## Line Chart: Performance Comparison of RAG Methods Across Source Text Lengths
### Overview
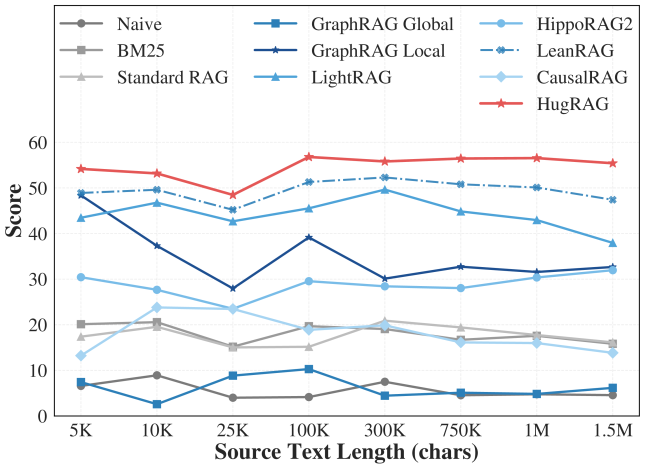
This line chart compares the performance scores of ten different Retrieval-Augmented Generation (RAG) methods as a function of increasing source text length, measured in characters. The chart demonstrates how each method's effectiveness (score) changes as the input text scales from 5,000 to 1.5 million characters.
### Components/Axes
* **Chart Type:** Multi-series line chart.
* **X-Axis (Horizontal):**
* **Label:** `Source Text Length (chars)`
* **Scale:** Categorical, not linear. The marked points are: `5K`, `10K`, `25K`, `100K`, `300K`, `750K`, `1M`, `1.5M`.
* **Y-Axis (Vertical):**
* **Label:** `Score`
* **Scale:** Linear, ranging from 0 to 60, with major gridlines at intervals of 10.
* **Legend:** Located at the top of the chart, spanning two rows. It maps method names to line styles and colors.
* **Row 1:** `Naive` (gray circle), `BM25` (gray square), `Standard RAG` (light gray triangle), `GraphRAG Global` (blue square), `GraphRAG Local` (dark blue star), `LightRAG` (light blue triangle).
* **Row 2:** `HippoRAG2` (light blue circle), `LeanRAG` (blue cross), `CausalRAG` (light blue diamond), `HugRAG` (red star).
### Detailed Analysis
**Trend Verification & Data Point Extraction (Approximate Values):**
1. **HugRAG (Red line with star markers):**
* **Trend:** Consistently the top-performing method. Shows a slight dip at 25K but otherwise maintains a high, relatively stable score.
* **Data Points:** 5K: ~54, 10K: ~53, 25K: ~48, 100K: ~57, 300K: ~55, 750K: ~56, 1M: ~56, 1.5M: ~55.
2. **LeanRAG (Blue dashed line with cross markers):**
* **Trend:** Second-best performer. Follows a similar pattern to HugRAG but at a slightly lower score level, with a more pronounced dip at 25K.
* **Data Points:** 5K: ~49, 10K: ~50, 25K: ~45, 100K: ~51, 300K: ~52, 750K: ~51, 1M: ~50, 1.5M: ~47.
3. **LightRAG (Light blue line with triangle markers):**
* **Trend:** Third-tier performance. Shows a general downward trend after an initial peak at 10K.
* **Data Points:** 5K: ~43, 10K: ~47, 25K: ~42, 100K: ~45, 300K: ~49, 750K: ~45, 1M: ~43, 1.5M: ~38.
4. **GraphRAG Local (Dark blue line with star markers):**
* **Trend:** Highly volatile. Starts high, drops sharply, recovers, then declines again.
* **Data Points:** 5K: ~49, 10K: ~37, 25K: ~28, 100K: ~39, 300K: ~30, 750K: ~33, 1M: ~31, 1.5M: ~33.
5. **HippoRAG2 (Light blue line with circle markers):**
* **Trend:** Relatively stable in the mid-range, with a slight peak at 100K.
* **Data Points:** 5K: ~30, 10K: ~28, 25K: ~24, 100K: ~30, 300K: ~29, 750K: ~28, 1M: ~30, 1.5M: ~32.
6. **CausalRAG (Light blue line with diamond markers):**
* **Trend:** Shows a distinct peak at 10K, then generally declines.
* **Data Points:** 5K: ~13, 10K: ~24, 25K: ~23, 100K: ~19, 300K: ~20, 750K: ~16, 1M: ~16, 1.5M: ~14.
7. **Standard RAG (Light gray line with triangle markers):**
* **Trend:** Low and relatively flat performance.
* **Data Points:** 5K: ~18, 10K: ~20, 25K: ~15, 100K: ~15, 300K: ~20, 750K: ~19, 1M: ~17, 1.5M: ~16.
8. **BM25 (Gray line with square markers):**
* **Trend:** Very low performance, similar to Standard RAG but slightly lower on average.
* **Data Points:** 5K: ~20, 10K: ~20, 25K: ~15, 100K: ~19, 300K: ~18, 750K: ~17, 1M: ~17, 1.5M: ~16.
9. **GraphRAG Global (Blue line with square markers):**
* **Trend:** Consistently very low performance, near the bottom.
* **Data Points:** 5K: ~7, 10K: ~3, 25K: ~9, 100K: ~10, 300K: ~5, 750K: ~5, 1M: ~5, 1.5M: ~6.
10. **Naive (Gray line with circle markers):**
* **Trend:** The lowest-performing method overall, with minimal variation.
* **Data Points:** 5K: ~8, 10K: ~9, 25K: ~4, 100K: ~4, 300K: ~8, 750K: ~5, 1M: ~5, 1.5M: ~5.
### Key Observations
1. **Performance Hierarchy:** A clear stratification exists. `HugRAG` and `LeanRAG` form a top tier. `LightRAG`, `GraphRAG Local`, and `HippoRAG2` form a volatile middle tier. The remaining methods (`CausalRAG`, `Standard RAG`, `BM25`, `GraphRAG Global`, `Naive`) occupy a lower tier with scores generally below 25.
2. **The 25K Dip:** Nearly all methods (except `GraphRAG Global` and `Naive`) show a noticeable performance dip at the 25K character length mark, suggesting a common challenge point for these architectures.
3. **Scalability:** `HugRAG` and `LeanRAG` demonstrate the best scalability, maintaining high scores even at 1.5M characters. In contrast, methods like `LightRAG` and `GraphRAG Local` show significant degradation at the longest text length.
4. **Baseline Comparison:** Traditional methods like `BM25` and `Standard RAG` are consistently outperformed by the more advanced graph-based and proposed methods (`HugRAG`, `LeanRAG`).
### Interpretation
The data suggests that the architectural innovations in `HugRAG` and `LeanRAG` provide significant and robust advantages in processing long documents, as measured by the "Score" metric (likely accuracy, F1, or a similar QA benchmark). Their ability to maintain performance as text length increases from 5K to 1.5M characters indicates superior information retrieval and synthesis capabilities over the baseline and other compared methods.
The universal dip at 25K characters is a critical finding. It may indicate a specific scale where the chunking, indexing, or retrieval mechanisms of most tested systems become suboptimal—perhaps a transition point between handling "paragraph-level" and "document-level" context. The methods that recover well after this dip (`HugRAG`, `LeanRAG`) likely have more resilient mechanisms for navigating this complexity.
The poor performance of `GraphRAG Global` compared to its `Local` variant is intriguing. It suggests that a global graph approach, without localized context retrieval, may be ineffective for this task, or that its implementation here is flawed. The consistently low scores of `Naive` and `BM25` serve as expected baselines, confirming that the task requires more sophisticated retrieval and generation strategies.