## Line Graph: RAG Model Performance vs. Source Text Length
### Overview
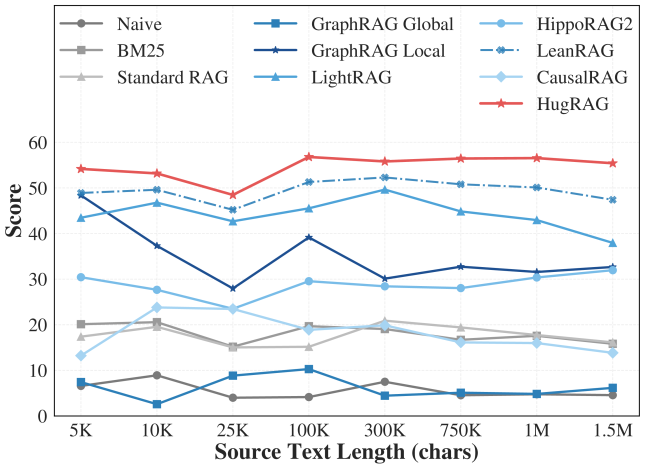
The graph compares the performance scores of various RAG (Retrieval-Augmented Generation) models across different source text lengths (5K to 1.5M characters). Performance is measured on a scale of 0-60, with higher scores indicating better performance.
### Components/Axes
- **X-axis**: Source Text Length (chars)
Markers: 5K, 10K, 25K, 100K, 300K, 750K, 1M, 1.5M
- **Y-axis**: Score (0-60)
- **Legend**: Positioned on the right, mapping colors/markers to models:
- Naive (gray circles)
- BM25 (gray squares)
- Standard RAG (gray triangles)
- GraphRAG Global (blue squares)
- GraphRAG Local (dark blue stars)
- LeanRAG (dashed blue line)
- LightRAG (light blue triangles)
- CausalRAG (light blue diamonds)
- HugRAG (red stars)
### Detailed Analysis
1. **HugRAG (red stars)**:
- Starts at ~55 at 5K, dips slightly to ~53 at 10K, then stabilizes between 55-57 up to 1.5M.
- **Trend**: Consistently highest performer across all text lengths.
2. **GraphRAG Global (blue squares)**:
- Starts at ~50 at 5K, drops to ~0 at 10K, rises to ~10 at 25K, peaks at ~15 at 100K, then declines to ~5 at 1.5M.
- **Trend**: Volatile, with significant drops at smaller text lengths.
3. **GraphRAG Local (dark blue stars)**:
- Starts at ~50 at 5K, dips to ~30 at 10K, peaks at ~40 at 100K, then declines to ~30 at 1.5M.
- **Trend**: Strong at mid-range text lengths but underperforms at extremes.
4. **LeanRAG (dashed blue line)**:
- Starts at ~50 at 5K, remains stable between 50-52 up to 1.5M.
- **Trend**: Most consistent high performer after HugRAG.
5. **LightRAG (light blue triangles)**:
- Starts at ~30 at 5K, dips to ~20 at 10K, rises to ~30 at 100K, then declines to ~25 at 1.5M.
- **Trend**: Moderate performance with mid-range peaks.
6. **CausalRAG (light blue diamonds)**:
- Starts at ~15 at 5K, rises to ~20 at 10K, stabilizes between 18-20 up to 1.5M.
- **Trend**: Steady but lower performance.
7. **Naive (gray circles)**:
- Starts at ~20 at 5K, dips to ~15 at 10K, stabilizes between 15-18 up to 1.5M.
- **Trend**: Low but stable.
8. **BM25 (gray squares)**:
- Starts at ~18 at 5K, dips to ~15 at 10K, stabilizes between 15-17 up to 1.5M.
- **Trend**: Slightly better than Naive but still low.
9. **Standard RAG (gray triangles)**:
- Starts at ~15 at 5K, dips to ~12 at 10K, rises to ~18 at 100K, then declines to ~15 at 1.5M.
- **Trend**: Volatile but outperforms Naive/BM25 at mid-range lengths.
### Key Observations
- **HugRAG** and **LeanRAG** dominate performance across all text lengths.
- **GraphRAG Global** and **Local** show significant drops at 10K but recover at larger lengths.
- Traditional models (**Naive**, **BM25**, **Standard RAG**) underperform but remain stable.
- **LightRAG** and **CausalRAG** exhibit moderate performance, with LightRAG peaking at 100K.
### Interpretation
The data suggests that newer RAG models (e.g., HugRAG, LeanRAG) outperform traditional methods (Naive, BM25) and even standard RAG variants, particularly as text length increases. GraphRAG models excel at larger text sizes but struggle with smaller inputs, indicating potential optimization opportunities. The consistency of LeanRAG and HugRAG highlights their robustness, making them ideal for applications requiring reliable performance across diverse text lengths. Traditional models, while less effective, may still be viable for specific use cases with limited computational resources.