\n
## Bar Chart: F1 Score and BLEU-1 Score vs. k Values
### Overview
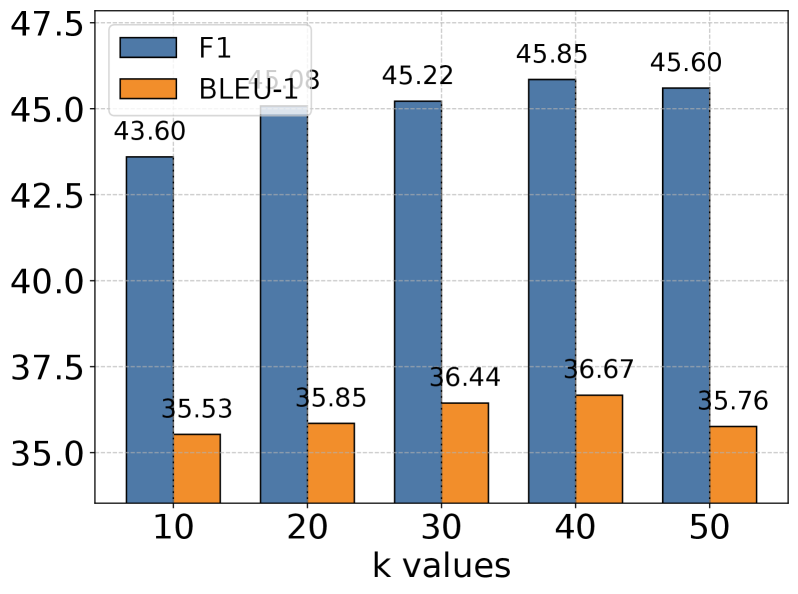
This bar chart compares the F1 score and BLEU-1 score for different 'k' values. The chart displays these scores as bar heights for k values ranging from 10 to 50, incrementing by 10. The F1 score is consistently higher than the BLEU-1 score across all k values.
### Components/Axes
* **X-axis:** "k values" with markers at 10, 20, 30, 40, and 50.
* **Y-axis:** Scale ranging from 35.0 to 47.5.
* **Legend:** Located in the top-left corner.
* Blue bars represent "F1".
* Orange bars represent "BLEU-1".
### Detailed Analysis
The chart presents data for five k values. Here's a breakdown of the values:
* **k = 10:**
* F1: Approximately 43.60
* BLEU-1: Approximately 35.53
* **k = 20:**
* F1: Approximately 45.13
* BLEU-1: Approximately 35.85
* **k = 30:**
* F1: Approximately 45.22
* BLEU-1: Approximately 36.44
* **k = 40:**
* F1: Approximately 45.85
* BLEU-1: Approximately 36.67
* **k = 50:**
* F1: Approximately 45.60
* BLEU-1: Approximately 35.76
**Trends:**
* **F1 Score:** The F1 score generally increases from k=10 to k=40, then slightly decreases at k=50. The increase is most pronounced between k=10 and k=20.
* **BLEU-1 Score:** The BLEU-1 score shows a slight increase from k=10 to k=30, then decreases slightly from k=30 to k=50. The changes are less dramatic than those observed in the F1 score.
### Key Observations
* The F1 score consistently outperforms the BLEU-1 score across all k values.
* The F1 score peaks at k=40, suggesting that this value might be optimal for maximizing F1 performance.
* The BLEU-1 score remains relatively stable across the range of k values.
* The difference between the F1 and BLEU-1 scores is approximately 8-10 points across all k values.
### Interpretation
The chart demonstrates the relationship between the 'k' parameter and the performance of a model, as measured by the F1 score and BLEU-1 score. The 'k' parameter likely represents a value used in a retrieval or generation process (e.g., k-nearest neighbors, beam search).
The increasing F1 score with increasing 'k' (up to k=40) suggests that increasing the value of 'k' allows the model to consider more relevant information or generate more accurate outputs, leading to improved performance. However, the slight decrease in F1 score at k=50 could indicate that beyond a certain point, increasing 'k' introduces noise or irrelevant information, diminishing performance.
The relatively low and stable BLEU-1 score suggests that the model's generated text may not have high n-gram overlap with reference texts, even as the F1 score improves. This could indicate that the model is generating outputs that are semantically correct (as reflected in the F1 score) but syntactically different from the reference texts (as reflected in the BLEU-1 score).
The consistent gap between the F1 and BLEU-1 scores highlights the limitations of BLEU as a metric for evaluating the quality of generated text, particularly when semantic correctness is prioritized over n-gram overlap.