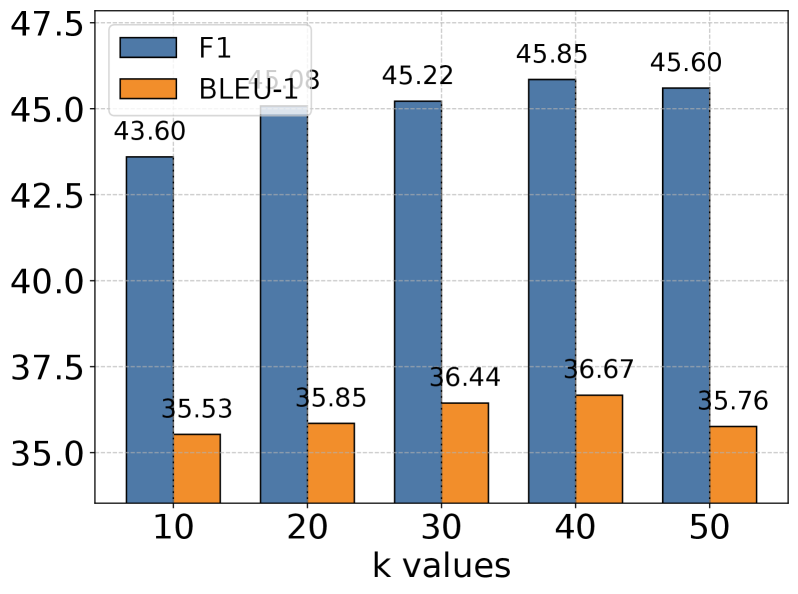
## Grouped Bar Chart: F1 vs. BLEU-1 Scores Across k Values
### Overview
This is a grouped bar chart comparing the performance of two metrics, F1 and BLEU-1, across five different "k values" (10, 20, 30, 40, 50). The chart demonstrates how these two evaluation scores change as the parameter `k` increases.
### Components/Axes
* **Chart Type:** Grouped Bar Chart.
* **X-Axis:** Labeled **"k values"**. It contains five categorical groups: `10`, `20`, `30`, `40`, `50`.
* **Y-Axis:** Numerical scale ranging from **35.0** to **47.5**, with major tick marks at intervals of 2.5 (35.0, 37.5, 40.0, 42.5, 45.0, 47.5). The axis title is not explicitly stated but represents the score value.
* **Legend:** Positioned in the **top-left corner** of the chart area.
* A blue square corresponds to the label **"F1"**.
* An orange square corresponds to the label **"BLEU-1"**.
* **Data Series:** Two series of bars are plotted for each k value.
* **F1 Series (Blue Bars):** Positioned on the **left** within each k-value group.
* **BLEU-1 Series (Orange Bars):** Positioned on the **right** within each k-value group.
### Detailed Analysis
**Data Points and Trends:**
1. **k = 10:**
* **F1 (Blue, Left):** The bar height corresponds to the value **43.60**, annotated directly above the bar.
* **BLEU-1 (Orange, Right):** The bar height corresponds to the value **35.53**, annotated directly above the bar.
* *Trend Check:* F1 score is significantly higher than BLEU-1 at this starting point.
2. **k = 20:**
* **F1 (Blue, Left):** The bar height corresponds to the value **45.03**, annotated directly above the bar.
* **BLEU-1 (Orange, Right):** The bar height corresponds to the value **35.85**, annotated directly above the bar.
* *Trend Check:* Both scores show a slight increase from k=10. The F1 score increases by ~1.43 points, while BLEU-1 increases by ~0.32 points.
3. **k = 30:**
* **F1 (Blue, Left):** The bar height corresponds to the value **45.22**, annotated directly above the bar.
* **BLEU-1 (Orange, Right):** The bar height corresponds to the value **36.44**, annotated directly above the bar.
* *Trend Check:* F1 continues a very slight upward trend (+0.19). BLEU-1 shows a more noticeable increase (+0.59).
4. **k = 40:**
* **F1 (Blue, Left):** The bar height corresponds to the value **45.85**, annotated directly above the bar.
* **BLEU-1 (Orange, Right):** The bar height corresponds to the value **36.67**, annotated directly above the bar.
* *Trend Check:* This represents the **peak value for both metrics** in this chart. F1 increases by +0.63, and BLEU-1 increases by +0.23 from k=30.
5. **k = 50:**
* **F1 (Blue, Left):** The bar height corresponds to the value **45.60**, annotated directly above the bar.
* **BLEU-1 (Orange, Right):** The bar height corresponds to the value **35.76**, annotated directly above the bar.
* *Trend Check:* Both metrics show a **decline** from their peak at k=40. F1 decreases by -0.25, and BLEU-1 decreases more sharply by -0.91.
### Key Observations
1. **Consistent Performance Gap:** The F1 score is consistently and significantly higher (by approximately 8-10 points) than the BLEU-1 score across all tested k values.
2. **Similar Trend Pattern:** Both metrics follow a similar trajectory: they increase from k=10 to k=40 and then decrease at k=50. This suggests the parameter `k` influences both evaluation aspects in a correlated manner.
3. **Optimal k Value:** The data indicates that **k=40** yields the highest performance for both the F1 and BLEU-1 metrics within the tested range.
4. **Sensitivity at Higher k:** The drop in performance from k=40 to k=50 is more pronounced for BLEU-1 (-0.91) than for F1 (-0.25), suggesting BLEU-1 may be more sensitive to increases in `k` beyond the optimal point.
### Interpretation
This chart likely evaluates a machine learning or natural language processing model where `k` is a hyperparameter (e.g., the number of candidates considered, beam search width, or nearest neighbors). The F1 score (a measure of a test's accuracy, balancing precision and recall) and BLEU-1 (a metric for evaluating machine-translated text against human references, focusing on unigram precision) are used as complementary performance indicators.
The data suggests that increasing the `k` parameter generally improves model performance up to a point (k=40), after which performance degrades. This is a classic example of a **bias-variance tradeoff** or a **diminishing returns** scenario. A very low `k` might be too restrictive (high bias), missing good solutions. An excessively high `k` (k=50) might introduce noise or computational inefficiency (high variance), leading to worse outcomes. The consistent gap between F1 and BLEU-1 implies that while the model's overall predictive accuracy (F1) is relatively high, its specific precision in matching reference outputs (BLEU-1) is lower, which is common in generative tasks. The key takeaway for a practitioner would be to set `k` to approximately 40 for optimal results on these combined metrics.