# Technical Document Extraction: Bar Chart Analysis
## Chart Overview
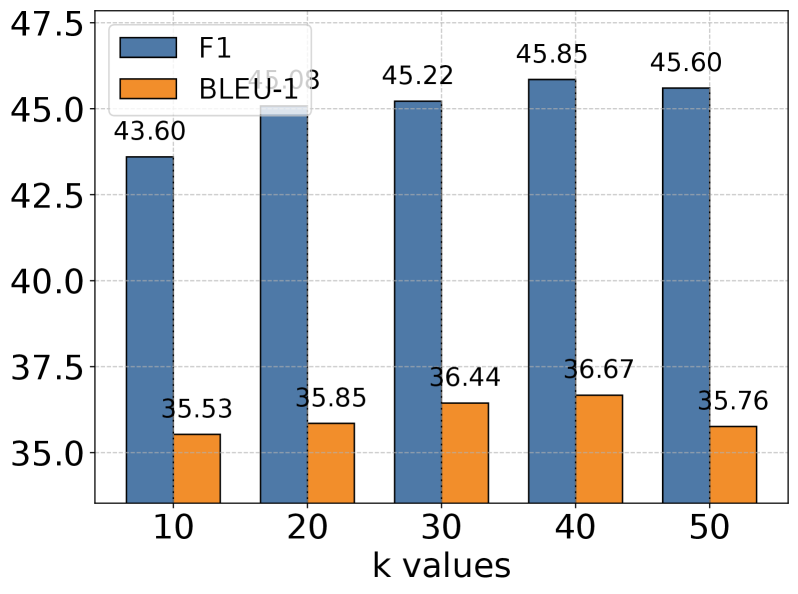
- **Type**: Grouped Bar Chart
- **Purpose**: Comparison of performance metrics (F1 and BLEU-1) across varying `k` values (10, 20, 30, 40, 50).
---
## Axis Labels and Markers
- **X-Axis**:
- Title: `k values`
- Categories: `10`, `20`, `30`, `40`, `50`
- Scale: Discrete intervals
- **Y-Axis**:
- Title: *Unlabeled* (implied metric score)
- Range: `35.0` to `47.5`
- Increment: `2.5` units
- Gridlines: Dashed horizontal lines
---
## Legend
- **Location**: Top-left corner
- **Entries**:
- `F1`: Blue bars
- `BLEU-1`: Orange bars
---
## Data Points and Trends
### F1 (Blue Bars)
- **Trend**:
- Starts at `43.60` (k=10)
- Increases steadily to `45.85` (k=40)
- Slight decline to `45.60` (k=50)
- **Values**:
- k=10: `43.60`
- k=20: `45.08`
- k=30: `45.22`
- k=40: `45.85`
- k=50: `45.60`
### BLEU-1 (Orange Bars)
- **Trend**:
- Starts at `35.53` (k=10)
- Peaks at `36.67` (k=40)
- Declines to `35.76` (k=50)
- **Values**:
- k=10: `35.53`
- k=20: `35.85`
- k=30: `36.44`
- k=40: `36.67`
- k=50: `35.76`
---
## Spatial Grounding
- **Legend Position**: `[x=0, y=top-left]` (relative to chart boundaries)
- **Bar Alignment**:
- Blue (F1) bars consistently taller than orange (BLEU-1) bars across all `k` values.
---
## Data Table Reconstruction
| k Value | F1 Score | BLEU-1 Score |
|---------|----------|--------------|
| 10 | 43.60 | 35.53 |
| 20 | 45.08 | 35.85 |
| 30 | 45.22 | 36.44 |
| 40 | 45.85 | 36.67 |
| 50 | 45.60 | 35.76 |
---
## Observations
1. **F1 Dominance**: F1 scores are consistently higher than BLEU-1 across all `k` values.
2. **Optimal k for F1**: `k=40` yields the highest F1 score (`45.85`).
3. **BLEU-1 Peak**: BLEU-1 reaches its maximum at `k=40` (`36.67`), followed by a decline.
4. **Stability**: F1 shows minimal fluctuation compared to BLEU-1, which exhibits a sharper decline after `k=40`.
---
## Language Notes
- **Primary Language**: English
- **No Additional Languages Detected**
---
## Critical Validation Checks
1. **Color Consistency**:
- Blue bars (F1) match legend entry.
- Orange bars (BLEU-1) match legend entry.
2. **Trend Verification**:
- F1’s peak at `k=40` aligns with visual height.
- BLEU-1’s decline after `k=40` matches numerical data.
3. **Axis Alignment**:
- Y-axis values correspond to bar heights (e.g., `45.85` at `k=40` for F1).
---
## Conclusion
The chart illustrates a performance comparison where F1 consistently outperforms BLEU-1, with both metrics peaking at `k=40`. The slight decline in F1 at `k=50` suggests diminishing returns beyond this threshold.