## Circuit Diagram and Performance Chart
### Overview
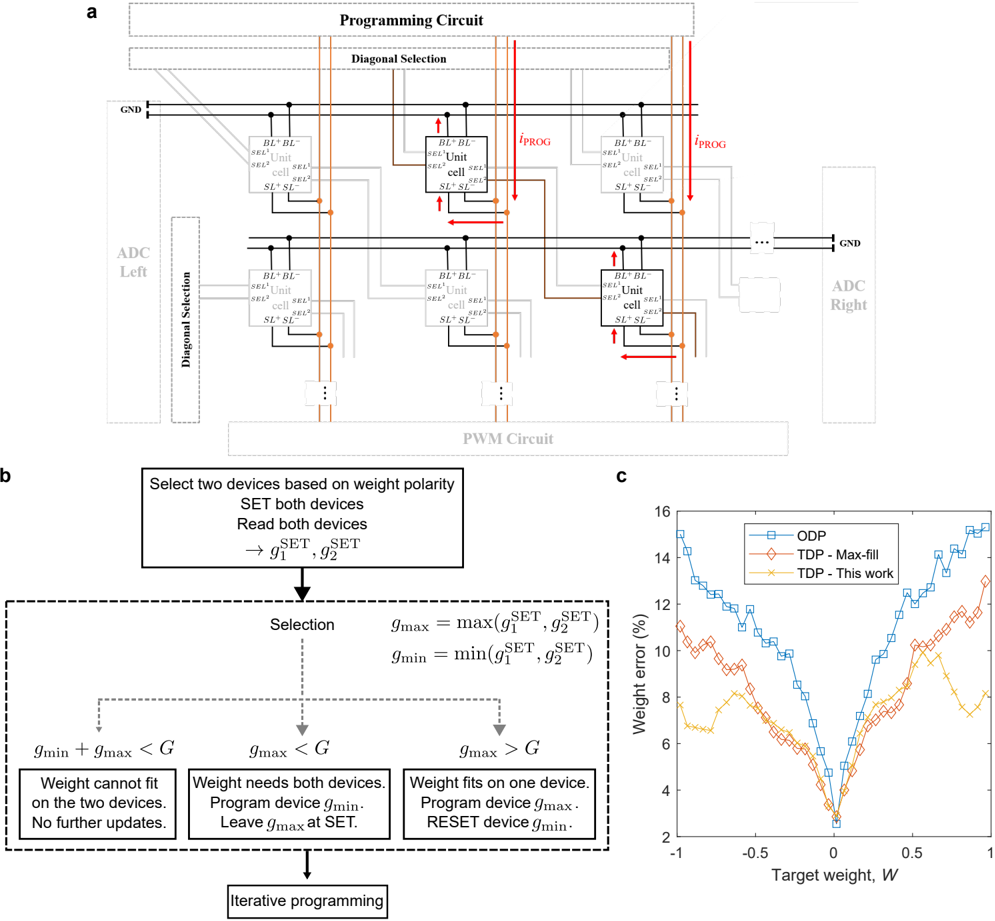
The image presents a combination of a circuit diagram, a flowchart, and a performance chart. The circuit diagram illustrates a programming circuit with diagonal selection and ADC components. The flowchart outlines a process for selecting and programming devices based on weight polarity. The performance chart compares the weight error of different programming methods (ODP, TDP-Max-fill, and TDP-This work) against the target weight.
### Components/Axes
**Part A: Circuit Diagram**
* **Title:** Programming Circuit
* **Components:**
* GND (Ground) on the left and right sides.
* ADC Left (Analog-to-Digital Converter on the left).
* ADC Right (Analog-to-Digital Converter on the right).
* PWM Circuit (Pulse Width Modulation Circuit at the bottom).
* Diagonal Selection (indicated above the cell arrays).
* Multiple "Unit cell" blocks, each labeled with "BL+ BL-", "SEL+ SEL-", "SL+ SL-".
* Current flow arrows labeled "iPROG".
**Part B: Flowchart**
* **Title:** None explicitly stated, but it describes a device selection and programming process.
* **Steps:**
1. "Select two devices based on weight polarity"
2. "SET both devices"
3. "Read both devices"
4. "Selection" block with calculations: gmax = max(g1SET, g2SET), gmin = min(g1SET, g2SET)
5. Decision branches based on gmax and gmin compared to G:
* gmin + gmax < G: "Weight cannot fit on the two devices. No further updates."
* gmax < G: "Weight needs both devices. Program device gmin. Leave gmax at SET."
* gmax > G: "Weight fits on one device. Program device gmax. RESET device gmin."
6. "Iterative programming"
**Part C: Performance Chart**
* **Title:** None explicitly stated, but it shows weight error vs. target weight.
* **Axes:**
* X-axis: "Target weight, W" ranging from -1 to 1 in increments of 0.5.
* Y-axis: "Weight error (%)" ranging from 2 to 16 in increments of 2.
* **Legend (Top-Right):**
* Blue squares: "ODP"
* Orange diamonds: "TDP - Max-fill"
* Yellow crosses: "TDP - This work"
### Detailed Analysis or Content Details
**Part A: Circuit Diagram**
* The circuit diagram shows a matrix-like structure with multiple unit cells.
* Each unit cell has labels "BL+", "BL-", "SEL+", "SEL-", "SL+", "SL-".
* The "Diagonal Selection" is indicated by dashed boxes.
* Current flow (iPROG) is shown with red arrows.
**Part B: Flowchart**
* The flowchart describes an iterative programming process.
* It starts by selecting two devices based on weight polarity and setting them.
* The conductances (g1SET, g2SET) of the devices are read.
* The maximum (gmax) and minimum (gmin) conductances are calculated.
* Based on the relationship between gmax, gmin, and a threshold G, different programming actions are taken.
**Part C: Performance Chart**
* **ODP (Blue Squares):** The weight error starts at approximately 14% at W = -1, decreases to a minimum of around 3% at W = 0, and then increases to approximately 15% at W = 1.
* **TDP - Max-fill (Orange Diamonds):** The weight error starts at approximately 10% at W = -1, decreases to a minimum of around 2% at W = 0, and then increases to approximately 13% at W = 1.
* **TDP - This work (Yellow Crosses):** The weight error starts at approximately 7% at W = -1, decreases to a minimum of around 2% at W = 0, and then increases to approximately 8% at W = 1.
### Key Observations
* The circuit diagram shows a specific architecture for a programming circuit.
* The flowchart outlines a detailed algorithm for device selection and programming.
* The performance chart demonstrates that "TDP - This work" generally achieves lower weight error compared to "ODP" and "TDP - Max-fill" across the target weight range.
* All three methods exhibit the lowest weight error around W = 0.
### Interpretation
The image presents a system for programming devices, likely for use in neuromorphic computing or similar applications. The circuit diagram shows the hardware architecture, while the flowchart details the programming algorithm. The performance chart provides evidence that the "TDP - This work" method is more effective in reducing weight error compared to the other two methods. The fact that all methods perform best around W = 0 suggests that programming devices to achieve weights close to zero is more accurate than programming them to achieve larger positive or negative weights. The iterative programming approach in the flowchart likely aims to refine the device weights to achieve the desired target weight with minimal error.