## Line Chart: Guided beam search: MATH-500
### Overview
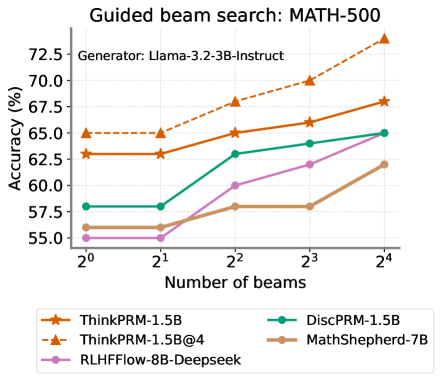
The image is a line chart comparing the accuracy (%) of different language models on the MATH-500 dataset using guided beam search, plotted against the number of beams (2^0 to 2^4). The generator used is Llama-3.2-3B-Instruct. The chart displays the performance of five models: ThinkPRM-1.5B, ThinkPRM-1.5B@4, DiscPRM-1.5B, MathShepherd-7B, and RLHFFlow-8B-Deepseek.
### Components/Axes
* **Title:** Guided beam search: MATH-500
* **Subtitle:** Generator: Llama-3.2-3B-Instruct
* **Y-axis:** Accuracy (%)
* Scale ranges from 55.0% to 72.5% in increments of 2.5%.
* **X-axis:** Number of beams
* Scale: 2^0, 2^1, 2^2, 2^3, 2^4
* **Legend:** Located at the bottom of the chart.
* ThinkPRM-1.5B (orange line with star markers)
* ThinkPRM-1.5B@4 (dashed orange line with triangle markers)
* DiscPRM-1.5B (teal line with circle markers)
* MathShepherd-7B (brown line with circle markers)
* RLHFFlow-8B-Deepseek (purple line with circle markers)
### Detailed Analysis
* **ThinkPRM-1.5B (orange line with star markers):**
* Trend: Generally increasing accuracy with the number of beams.
* Data Points:
* 2^0: ~63%
* 2^1: ~63%
* 2^2: ~65%
* 2^3: ~66%
* 2^4: ~68%
* **ThinkPRM-1.5B@4 (dashed orange line with triangle markers):**
* Trend: Increasing accuracy with the number of beams.
* Data Points:
* 2^0: ~65%
* 2^1: ~65%
* 2^2: ~68%
* 2^3: ~70%
* 2^4: ~73%
* **DiscPRM-1.5B (teal line with circle markers):**
* Trend: Increasing accuracy with the number of beams.
* Data Points:
* 2^0: ~58%
* 2^1: ~58%
* 2^2: ~63%
* 2^3: ~64%
* 2^4: ~65%
* **MathShepherd-7B (brown line with circle markers):**
* Trend: Increasing accuracy with the number of beams.
* Data Points:
* 2^0: ~56%
* 2^1: ~56%
* 2^2: ~58%
* 2^3: ~58%
* 2^4: ~62%
* **RLHFFlow-8B-Deepseek (purple line with circle markers):**
* Trend: Increasing accuracy with the number of beams.
* Data Points:
* 2^0: ~56%
* 2^1: ~56%
* 2^2: ~60%
* 2^3: ~62%
* 2^4: ~63%
### Key Observations
* ThinkPRM-1.5B@4 consistently outperforms the other models across all beam sizes.
* ThinkPRM-1.5B and DiscPRM-1.5B show similar performance.
* MathShepherd-7B and RLHFFlow-8B-Deepseek have the lowest accuracy among the models tested.
* All models generally show an increase in accuracy as the number of beams increases, though some models plateau at lower beam counts.
### Interpretation
The chart illustrates the impact of guided beam search on the accuracy of different language models when solving problems in the MATH-500 dataset. The ThinkPRM-1.5B@4 model demonstrates the highest accuracy, suggesting it benefits most from the increased beam size. The other models show varying degrees of improvement with larger beam sizes, indicating that beam search is a useful technique for enhancing their performance, but to different extents. The performance difference between the models could be attributed to their architecture, training data, or other model-specific factors. The plateauing of some models suggests that there might be a point of diminishing returns for increasing the beam size, beyond which the computational cost outweighs the accuracy gains.