## Line Chart: MER Average vs N
### Overview
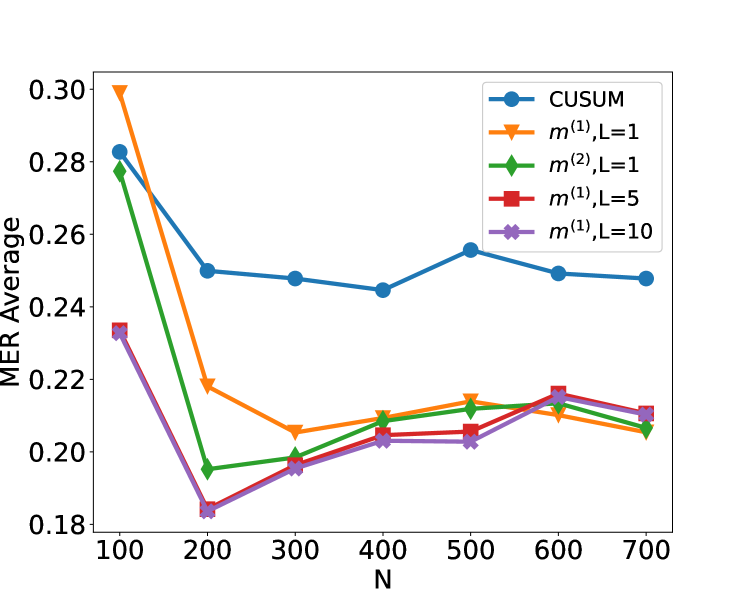
The image is a line chart comparing the MER (Minimum Error Rate) Average for different methods (CUSUM, m^(1) with L=1, m^(2) with L=1, m^(1) with L=5, and m^(1) with L=10) as a function of N. The x-axis represents N, ranging from 100 to 700. The y-axis represents the MER Average, ranging from 0.18 to 0.30.
### Components/Axes
* **X-axis:** N, with tick marks at 100, 200, 300, 400, 500, 600, and 700.
* **Y-axis:** MER Average, with tick marks at 0.18, 0.20, 0.22, 0.24, 0.26, 0.28, and 0.30.
* **Legend (top-right):**
* Blue line with circle markers: CUSUM
* Orange line with triangle markers: m^(1), L=1
* Green line with diamond markers: m^(2), L=1
* Red line with square markers: m^(1), L=5
* Purple line with pentagon markers: m^(1), L=10
### Detailed Analysis
* **CUSUM (Blue, Circle):** Starts at approximately 0.28 at N=100, decreases to around 0.25 at N=200, remains relatively stable around 0.25 until N=500, increases slightly to approximately 0.255 at N=500, and then decreases slightly to approximately 0.248 at N=700.
* N=100: 0.28
* N=200: 0.25
* N=300: 0.248
* N=400: 0.245
* N=500: 0.255
* N=600: 0.25
* N=700: 0.248
* **m^(1), L=1 (Orange, Triangle):** Starts at approximately 0.30 at N=100, decreases sharply to around 0.22 at N=200, and then gradually increases to approximately 0.21 at N=500, and then increases slightly to approximately 0.215 at N=600, and then decreases slightly to approximately 0.208 at N=700.
* N=100: 0.30
* N=200: 0.22
* N=300: 0.205
* N=400: 0.208
* N=500: 0.21
* N=600: 0.215
* N=700: 0.208
* **m^(2), L=1 (Green, Diamond):** Starts at approximately 0.28 at N=100, decreases sharply to around 0.195 at N=200, and then gradually increases to approximately 0.208 at N=700.
* N=100: 0.28
* N=200: 0.195
* N=300: 0.198
* N=400: 0.205
* N=500: 0.21
* N=600: 0.212
* N=700: 0.208
* **m^(1), L=5 (Red, Square):** Starts at approximately 0.235 at N=100, decreases to around 0.185 at N=200, and then gradually increases to approximately 0.215 at N=600, and then decreases slightly to approximately 0.212 at N=700.
* N=100: 0.235
* N=200: 0.185
* N=300: 0.195
* N=400: 0.205
* N=500: 0.208
* N=600: 0.215
* N=700: 0.212
* **m^(1), L=10 (Purple, Pentagon):** Starts at approximately 0.235 at N=100, decreases to around 0.185 at N=200, and then gradually increases to approximately 0.212 at N=600, and then decreases slightly to approximately 0.21 at N=700.
* N=100: 0.235
* N=200: 0.185
* N=300: 0.198
* N=400: 0.202
* N=500: 0.203
* N=600: 0.212
* N=700: 0.21
### Key Observations
* CUSUM has the highest MER Average overall, and its performance is relatively stable across different values of N.
* The other methods (m^(1), L=1; m^(2), L=1; m^(1), L=5; and m^(1), L=10) have a similar trend: a sharp decrease in MER Average from N=100 to N=200, followed by a gradual increase as N increases.
* For N greater than 300, the MER Average for m^(1), L=5 and m^(1), L=10 are very similar.
* For N greater than 300, the MER Average for m^(1), L=1 and m^(2), L=1 are very similar.
### Interpretation
The chart compares the performance of different methods for a specific task, as measured by the MER Average. The CUSUM method appears to be less sensitive to changes in N compared to the other methods. The methods m^(1), L=1; m^(2), L=1; m^(1), L=5; and m^(1), L=10 show a significant improvement in MER Average as N increases from 100 to 200, suggesting that increasing N initially improves performance. However, after N=200, the improvement becomes less pronounced, and the MER Average plateaus or even slightly decreases. The similar trends of m^(1), L=5 and m^(1), L=10, and m^(1), L=1 and m^(2), L=1 suggest that the parameter L has a limited impact on performance for N greater than 300.