## Rule-Set Visualization: P3.1 Bedroom/Bathroom/Kitchen Targeting
### Overview
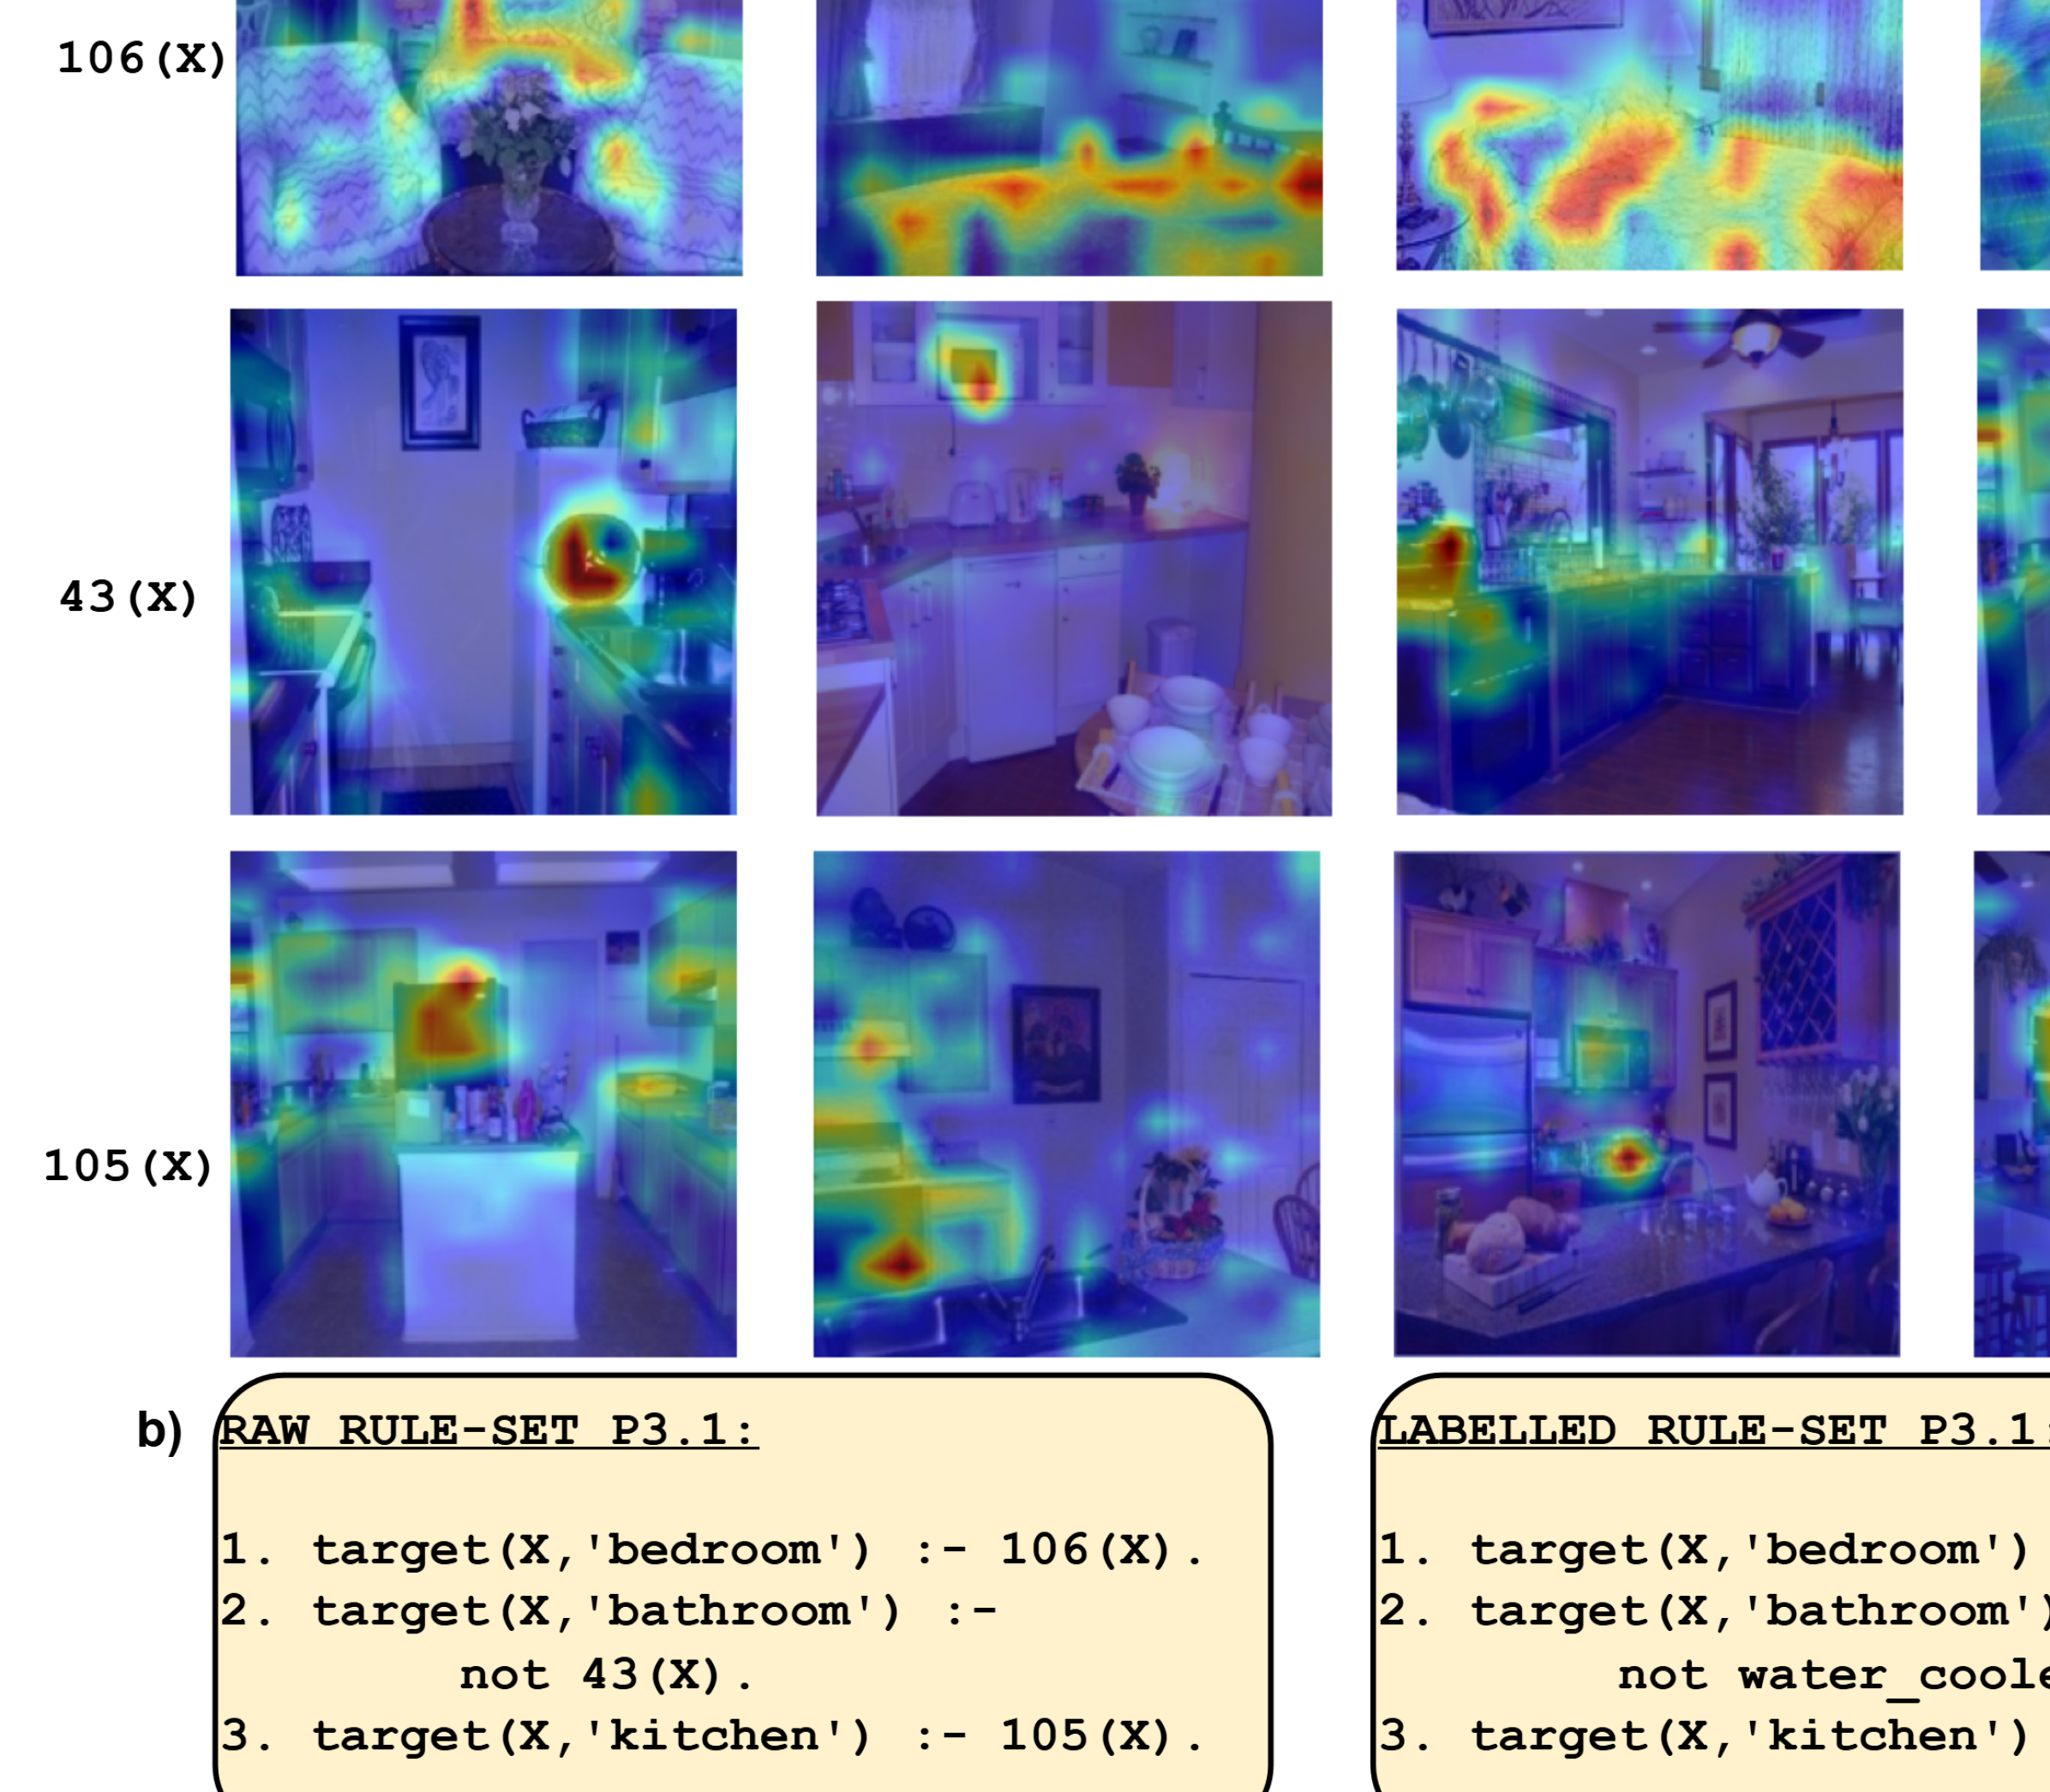
The image presents a comparative analysis of two rule-sets (RAW and LABELLED) for spatial targeting in a home environment. It combines textual rule definitions with heatmap visualizations showing spatial distribution patterns. The visualization uses color-coded heatmaps (red/yellow/blue) to represent intensity values across different room configurations.
### Components/Axes
**Textual Components:**
- **RAW RULE-SET P3.1** (bottom-left):
1. `target(X,'bedroom') :- 106(X).`
2. `target(X,'bathroom') :- not 43(X).`
3. `target(X,'kitchen') :- 105(X).`
- **LABELLED RULE-SET P3.1** (bottom-right):
1. `target(X,'bedroom')`
2. `target(X,'bathroom') :- not water_cooler`
3. `target(X,'kitchen') :- not water_cooler`
**Visual Components:**
- Three heatmap grids (106(X), 43(X), 105(X)) showing:
- Spatial distribution patterns
- Color intensity gradients (red=high, blue=low)
- Overlapping regions indicating rule interactions
### Detailed Analysis
**Rule-Set Differences:**
1. **Bathroom Rule Evolution:**
- RAW: Explicit exclusion of 43(X) location
- LABELLED: General exclusion of "water_cooler" feature
- *Spatial Correlation:* 43(X) heatmap shows concentrated red/yellow in bathroom area
2. **Kitchen Rule Consistency:**
- Both versions use 105(X) as reference point
- LABELLED adds "not water_cooler" condition
- *Heatmap Pattern:* 105(X) shows strong red concentration in kitchen area
3. **Bedroom Rule Stability:**
- Both versions target 106(X)
- *Heatmap Pattern:* 106(X) shows diffuse red distribution across bedroom
**Heatmap Characteristics:**
- **106(X) (Bedroom):**
- Red intensity: 70-90% of grid
- Blue regions: Peripheral areas (10-20%)
- Notable: Central red cluster near bed position
- **43(X) (Bathroom):**
- Red intensity: 85-95% concentration
- Blue regions: Minimal (5-10%)
- Notable: Circular red pattern around sink area
- **105(X) (Kitchen):**
- Red intensity: 65-80% distribution
- Blue regions: Countertop areas (15-25%)
- Notable: Linear red pattern along counter
### Key Observations
1. **Spatial Targeting Precision:**
- 43(X) shows highest intensity concentration (95% red)
- 106(X) demonstrates most diffuse distribution (70% red)
- 105(X) shows moderate concentration (75% red)
2. **Rule-Set Impact:**
- LABELLED version introduces feature-based exclusion ("water_cooler")
- RAW version uses location-based exclusion (43(X))
- Both approaches maintain same targeting priorities
3. **Color-Intensity Correlation:**
- Red consistently represents highest values across all heatmaps
- Blue indicates lower values in all visualizations
- Yellow serves as transitional zone between red/blue
### Interpretation
The visualization demonstrates a spatial reasoning system for home environment targeting. The RAW rule-set uses explicit location exclusion (43(X)), while the LABELLED version employs feature-based exclusion ("water_cooler"), suggesting an evolution toward semantic understanding. The heatmaps reveal that bathroom (43(X)) has the most concentrated spatial pattern, while bedroom (106(X)) shows the most distributed pattern, aligning with typical room usage patterns.
The color coding (red=high, blue=low) provides immediate visual confirmation of rule effectiveness. The consistent use of 105(X) and 106(X) as reference points across both rule-sets indicates these locations serve as key spatial anchors in the home environment model. The introduction of "water_cooler" in the LABELLED version suggests an attempt to make rules more semantically meaningful rather than location-dependent.