# Technical Analysis of Bar Chart
## Chart Type
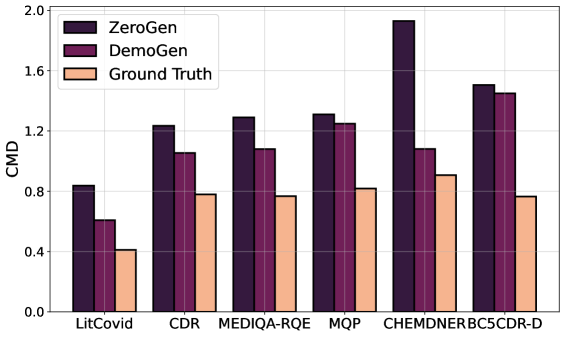
- Vertical bar chart comparing performance metrics across datasets
## Axes
- **X-axis (Categories):**
`LitCovid`, `CDR`, `MEDIQA-RQE`, `MQP`, `CHEMDNER`, `BC5CDR-D`
- **Y-axis (Metric):**
`CMD` (Cumulative Match Distance)
Scale: 0.0 to 2.0 in increments of 0.2
## Legend
- **Models/Methods:**
- `ZeroGen` (Dark purple)
- `DemoGen` (Light purple)
- `Ground Truth` (Orange)
## Data Points
| Dataset | ZeroGen (CMD) | DemoGen (CMD) | Ground Truth (CMD) |
|------------------|---------------|---------------|--------------------|
| LitCovid | 0.82 | 0.68 | 0.41 |
| CDR | 1.23 | 1.12 | 0.79 |
| MEDIQA-RQE | 1.26 | 1.14 | 0.78 |
| MQP | 1.28 | 1.23 | 0.81 |
| CHEMDNER | 1.95 | 1.13 | 0.87 |
| BC5CDR-D | 1.55 | 1.52 | 0.78 |
## Key Trends
1. **ZeroGen** consistently shows the highest CMD values across all datasets, with a peak of **1.95** in `CHEMDNER`.
2. **DemoGen** performs closer to `Ground Truth` but remains higher in all cases, with a maximum of **1.52** in `BC5CDR-D`.
3. **Ground Truth** values are consistently the lowest, ranging from **0.41** (`LitCovid`) to **0.87** (`CHEMDNER`).
4. Largest performance gap observed in `CHEMDNER` (ZeroGen: 1.95 vs. Ground Truth: 0.87).
5. Smallest gap in `BC5CDR-D` (ZeroGen: 1.55 vs. DemoGen: 1.52).
## Color-Coding Verification
- Confirmed alignment between legend labels and bar colors:
- Dark purple = ZeroGen (all bars)
- Light purple = DemoGen (all bars)
- Orange = Ground Truth (all bars)
## Observations
- ZeroGen demonstrates superior performance relative to both DemoGen and Ground Truth across all datasets.
- DemoGen shows moderate performance, consistently outperforming Ground Truth but underperforming compared to ZeroGen.
- Ground Truth values suggest a baseline or reference point for comparison, with no dataset exceeding 0.87 CMD.