Here is a detailed description of the information contained in the image.
### **Overview**
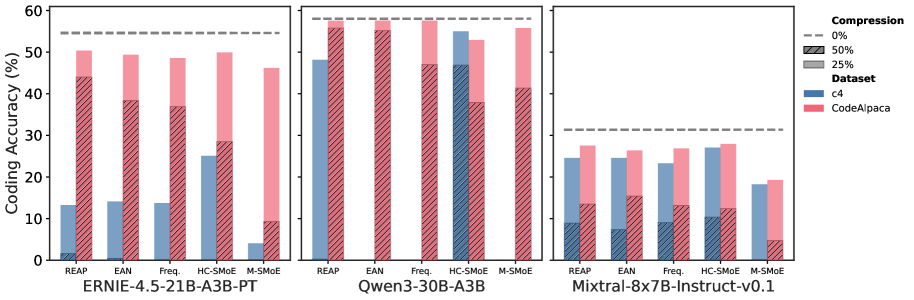
The image is a multi-panel bar chart comparing the "Coding Accuracy (%)" of three different language models under various compression techniques and datasets. The chart is divided into three panels, each representing a different model.
### **Common Elements**
* **Y-axis:** The vertical axis is labeled "Coding Accuracy (%)" and is common to all three panels. The scale ranges from 0 to 60, with major tick marks at every 10 units (0, 10, 20, 30, 40, 50, 60).
* **Legend:** A legend is located on the far right of the image, defining the coding for compression levels and datasets.
* **Compression:**
* **0%:** Represented by a dashed grey horizontal line.
* **50%:** Represented by a bar with diagonal hatching.
* **25%:** Represented by a solid grey bar (Note: In the chart, this corresponds to the solid colored bars).
* **Dataset:**
* **c4:** Represented by the color blue.
* **CodeAlpaca:** Represented by the color pink.
* **X-axis Categories:** Each panel shares the same categorical x-axis labels, representing different compression methods: "REAP", "EAN", "Freq.", "HC-SMoE", and "M-SMoE".
---
### **Panel 1: ERNIE-4.5-21B-A3B-PT**
This panel displays the results for the **ERNIE-4.5-21B-A3B-PT** model.
* **0% Compression Baseline:** The dashed grey line indicates a baseline accuracy of approximately **55%**.
**Data Table for ERNIE-4.5-21B-A3B-PT:**
| Method | Dataset | Solid Bar (approx. 25% Comp.) | Hatched Bar (50% Comp.) |
| :--- | :--- | :--- | :--- |
| **REAP** | c4 (Blue) | ~13% | ~2% |
| | CodeAlpaca (Pink) | ~50% | ~44% |
| **EAN** | c4 (Blue) | ~14% | ~1% |
| | CodeAlpaca (Pink) | ~49% | ~38% |
| **Freq.** | c4 (Blue) | ~13% | ~1% |
| | CodeAlpaca (Pink) | ~48% | ~37% |
| **HC-SMoE**| c4 (Blue) | ~25% | ~1% |
| | CodeAlpaca (Pink) | ~50% | ~28% |
| **M-SMoE** | c4 (Blue) | ~4% | ~1% |
| | CodeAlpaca (Pink) | ~46% | ~9% |
**Key Trends for ERNIE:**
* The CodeAlpaca dataset consistently yields significantly higher accuracy than the c4 dataset across all methods.
* Performance drops as compression increases (0% > solid bar > hatched bar).
* The HC-SMoE method shows the highest accuracy for the c4 dataset among the compressed models.
---
### **Panel 2: Qwen3-30B-A3B**
This panel displays the results for the **Qwen3-30B-A3B** model.
* **0% Compression Baseline:** The dashed grey line indicates a baseline accuracy of approximately **58%**.
**Data Table for Qwen3-30B-A3B:**
| Method | Dataset | Solid Bar (approx. 25% Comp.) | Hatched Bar (50% Comp.) |
| :--- | :--- | :--- | :--- |
| **REAP** | c4 (Blue) | ~48% | ~1% |
| | CodeAlpaca (Pink) | ~57% | ~56% |
| **EAN** | c4 (Blue) | ~1% | ~1% |
| | CodeAlpaca (Pink) | ~57% | ~55% |
| **Freq.** | c4 (Blue) | ~1% | ~1% |
| | CodeAlpaca (Pink) | ~58% | ~47% |
| **HC-SMoE**| c4 (Blue) | ~55% | ~47% |
| | CodeAlpaca (Pink) | ~53% | ~38% |
| **M-SMoE** | c4 (Blue) | ~1% | ~1% |
| | CodeAlpaca (Pink) | ~56% | ~41% |
**Key Trends for Qwen:**
* For the CodeAlpaca dataset, performance is very close to the 0% baseline for most methods, even at 50% compression.
* For the c4 dataset, the REAP and HC-SMoE methods maintain high accuracy at the solid bar level, but performance drops drastically for other methods and at 50% compression for REAP.
* HC-SMoE shows strong performance for both datasets.
---
### **Panel 3: Mixtral-8x7B-Instruct-v0.1**
This panel displays the results for the **Mixtral-8x7B-Instruct-v0.1** model.
* **0% Compression Baseline:** The dashed grey line indicates a baseline accuracy of approximately **31%**.
**Data Table for Mixtral-8x7B-Instruct-v0.1:**
| Method | Dataset | Solid Bar (approx. 25% Comp.) | Hatched Bar (50% Comp.) |
| :--- | :--- | :--- | :--- |
| **REAP** | c4 (Blue) | ~24% | ~9% |
| | CodeAlpaca (Pink) | ~27% | ~13% |
| **EAN** | c4 (Blue) | ~24% | ~7% |
| | CodeAlpaca (Pink) | ~26% | ~15% |
| **Freq.** | c4 (Blue) | ~23% | ~9% |
| | CodeAlpaca (Pink) | ~27% | ~13% |
| **HC-SMoE**| c4 (Blue) | ~27% | ~10% |
| | CodeAlpaca (Pink) | ~28% | ~12% |
| **M-SMoE** | c4 (Blue) | ~18% | ~1% |
| | CodeAlpaca (Pink) | ~19% | ~5% |
**Key Trends for Mixtral:**
* The overall accuracy is lower compared to the other two models.
* The difference in performance between the c4 and CodeAlpaca datasets is less pronounced than in the other panels.
* There is a significant drop in accuracy from the solid bar (approx. 25% compression) to the hatched bar (50% compression) across all methods and datasets.
* HC-SMoE generally performs the best among the compressed methods.