## Line Chart: EGA vs Perturbed (required items, action)
### Overview
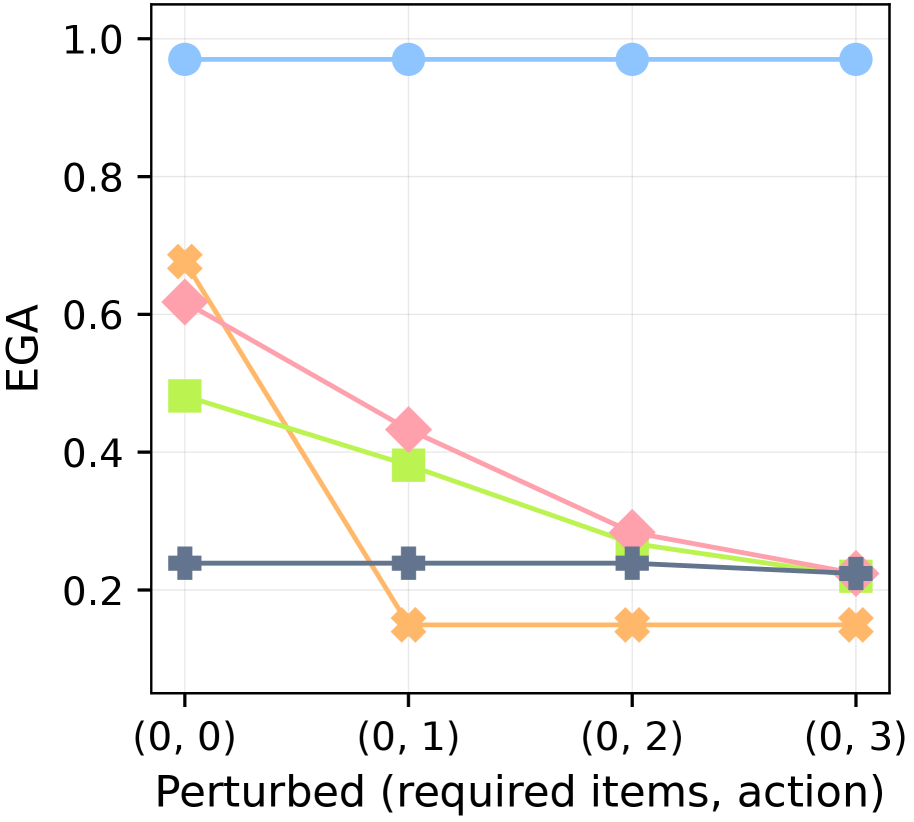
The image is a line chart displaying the relationship between EGA (Expected Goal Achievement) and "Perturbed (required items, action)". There are four distinct data series represented by different colored lines: light blue, light orange, light pink, light green, and dark grey. The x-axis represents the "Perturbed (required items, action)" with values (0, 0), (0, 1), (0, 2), and (0, 3). The y-axis represents EGA, ranging from 0.2 to 1.0.
### Components/Axes
* **X-axis:** "Perturbed (required items, action)" with labels (0, 0), (0, 1), (0, 2), and (0, 3).
* **Y-axis:** "EGA" (Expected Goal Achievement) with values 0.2, 0.4, 0.6, 0.8, and 1.0.
* **Data Series:**
* Light Blue: Constant value across all x-axis points.
* Light Orange: Decreases sharply from (0, 0) to (0, 1) and then remains constant.
* Light Pink: Decreases gradually from (0, 0) to (0, 3).
* Light Green: Decreases gradually from (0, 0) to (0, 3).
* Dark Grey: Remains relatively constant across all x-axis points.
### Detailed Analysis or ### Content Details
* **Light Blue Line:**
* Trend: Horizontal, indicating a constant EGA value.
* Values: Approximately 0.98 at (0, 0), (0, 1), (0, 2), and (0, 3).
* **Light Orange Line:**
* Trend: Decreases sharply from (0, 0) to (0, 1) and then remains constant.
* Values: Approximately 0.68 at (0, 0), approximately 0.15 at (0, 1), approximately 0.15 at (0, 2), and approximately 0.15 at (0, 3).
* **Light Pink Line:**
* Trend: Decreases gradually.
* Values: Approximately 0.62 at (0, 0), approximately 0.43 at (0, 1), approximately 0.28 at (0, 2), and approximately 0.22 at (0, 3).
* **Light Green Line:**
* Trend: Decreases gradually.
* Values: Approximately 0.48 at (0, 0), approximately 0.38 at (0, 1), approximately 0.24 at (0, 2), and approximately 0.22 at (0, 3).
* **Dark Grey Line:**
* Trend: Relatively constant.
* Values: Approximately 0.24 at (0, 0), approximately 0.24 at (0, 1), approximately 0.24 at (0, 2), and approximately 0.22 at (0, 3).
### Key Observations
* The light blue line maintains a consistently high EGA value regardless of the "Perturbed (required items, action)".
* The light orange line experiences a significant drop in EGA between (0, 0) and (0, 1), after which it stabilizes at a low value.
* The light pink and light green lines show a gradual decrease in EGA as the "Perturbed (required items, action)" increases.
* The dark grey line remains relatively stable, with a slight decrease at the end.
### Interpretation
The chart illustrates how different strategies or configurations (represented by the colored lines) perform under varying levels of perturbation. The light blue line represents a highly robust strategy, maintaining high EGA even when the "Perturbed (required items, action)" increases. The light orange line represents a strategy that is highly sensitive to initial perturbations, with performance plummeting after the first perturbation. The light pink and light green lines represent strategies that are moderately affected by perturbations, with a gradual decline in performance. The dark grey line represents a strategy that is consistently stable, but at a lower EGA level. The data suggests that the light blue strategy is the most resilient to perturbations, while the light orange strategy is the most vulnerable.