## Line Graph: EGA Trends Across Perturbed States
### Overview
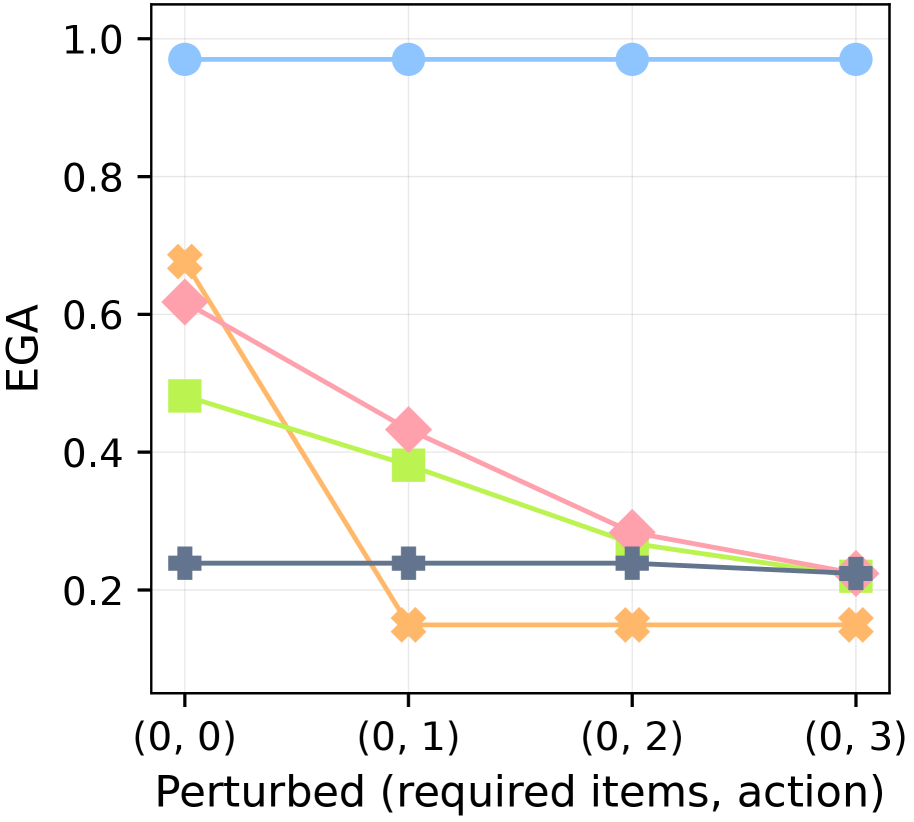
The image depicts a line graph comparing four data series labeled "EGA" across four perturbation states: (0,0), (0,1), (0,2), and (0,3). The y-axis represents EGA values (0.0–1.0), while the x-axis categorizes perturbations by "required items" and "action." Four distinct lines with unique markers and colors illustrate trends, with one line remaining constant and others showing declines.
### Components/Axes
- **X-Axis**: Labeled "Perturbed (required items, action)" with four categories:
- (0,0)
- (0,1)
- (0,2)
- (0,3)
- **Y-Axis**: Labeled "EGA" with a scale from 0.0 to 1.0 in increments of 0.2.
- **Legend**: Positioned on the right, associating colors and markers with labels:
- **Blue circles**: "EGA (no perturbation)"
- **Pink diamonds**: "EGA (perturbation: 1 item)"
- **Green squares**: "EGA (perturbation: 2 items)"
- **Orange crosses**: "EGA (perturbation: 3 items)"
### Detailed Analysis
1. **Blue Circles ("EGA (no perturbation)")**:
- Constant at **1.0** across all x-axis categories.
- Spatial grounding: Topmost line, horizontal trajectory.
2. **Pink Diamonds ("EGA (perturbation: 1 item)")**:
- Starts at **0.6** at (0,0), declines to **0.4** at (0,1), **0.3** at (0,2), and **0.2** at (0,3).
- Trend: Steady linear decrease.
3. **Green Squares ("EGA (perturbation: 2 items)")**:
- Starts at **0.5** at (0,0), declines to **0.4** at (0,1), **0.3** at (0,2), and **0.2** at (0,3).
- Trend: Gradual linear decrease, mirroring the pink line but with a lower baseline.
4. **Orange Crosses ("EGA (perturbation: 3 items)")**:
- Starts at **0.7** at (0,0), drops sharply to **0.15** at (0,1), then plateaus at **0.15** for (0,2) and (0,3).
- Trend: Abrupt decline followed by stabilization.
### Key Observations
- The **blue line** remains unaffected by perturbations, maintaining maximum EGA (1.0).
- **Orange crosses** exhibit the most drastic drop (0.7 → 0.15) between (0,0) and (0,1), suggesting a critical threshold for perturbations.
- **Pink and green lines** show proportional declines, with green consistently trailing pink by ~0.1 at each step.
- All non-blue lines converge at **0.2** by (0,3), indicating a shared lower bound under high perturbation.
### Interpretation
The data suggests that EGA is highly sensitive to perturbations in "required items" and "action." The **blue line's constancy** implies a baseline EGA unaffected by perturbations, possibly representing an ideal or control state. The **orange line's sharp decline** highlights a critical vulnerability when perturbations reach three items/actions, where EGA collapses by 80%. The gradual declines in pink and green lines indicate diminishing returns as perturbations increase, with green (2-item perturbations) consistently underperforming pink (1-item). This could reflect a hierarchical impact of perturbations on EGA, where higher perturbation levels disproportionately degrade performance. The convergence at 0.2 by (0,3) suggests a systemic limit to EGA under extreme conditions.