## Chart/Diagram Type: Multi-Panel Scientific Plot
### Overview
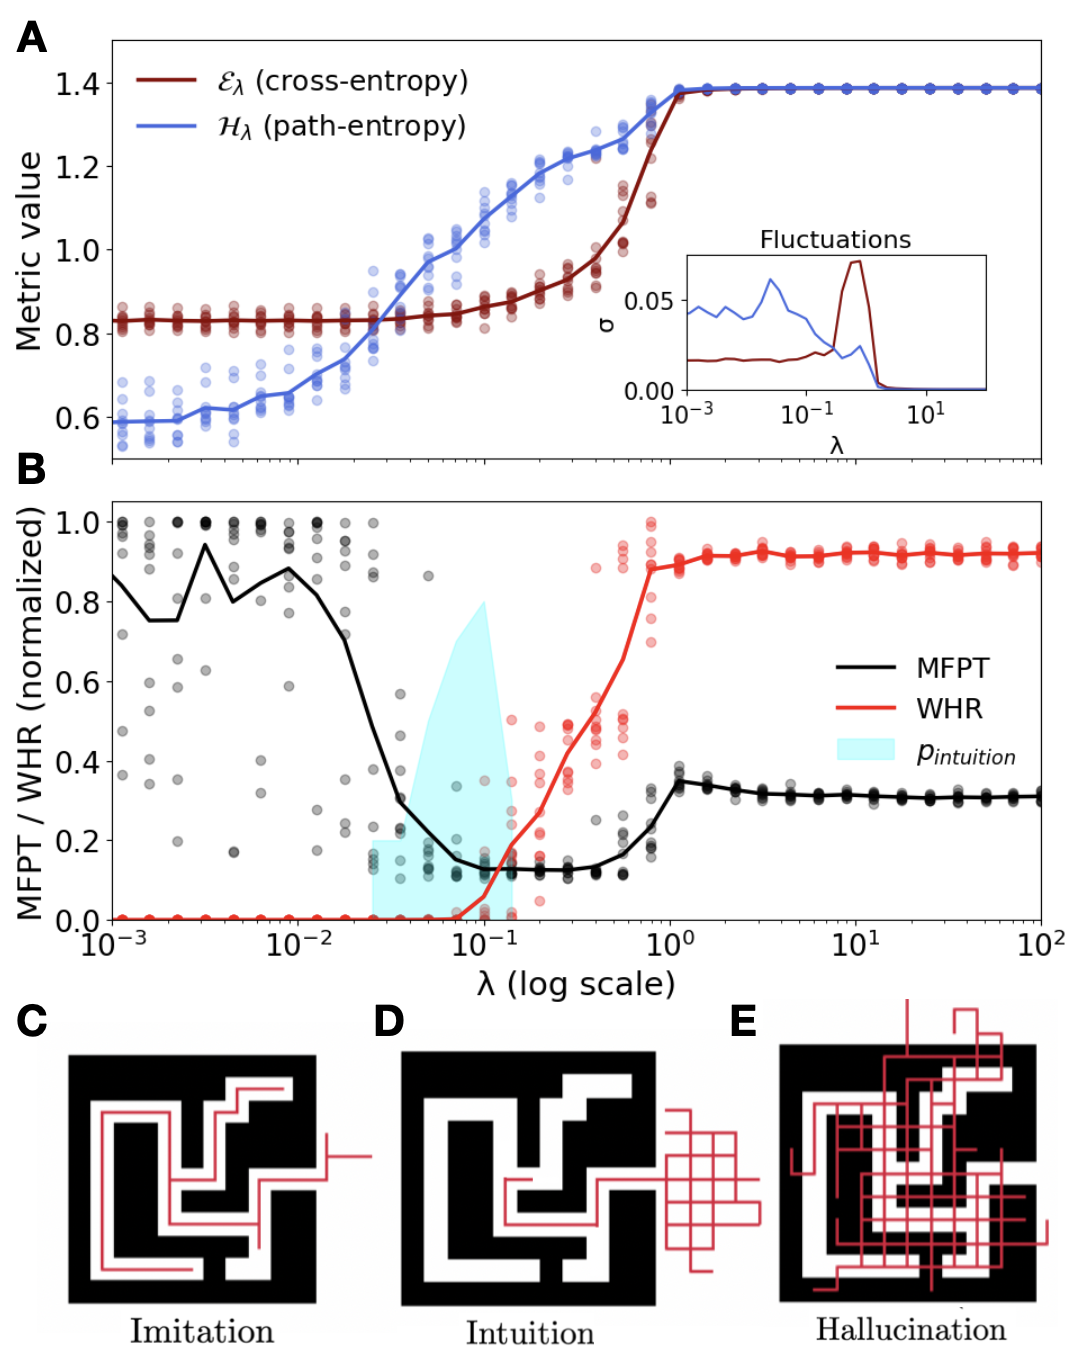
This image presents a multi-panel figure (A, B, C, D, E) exploring the relationship between a parameter λ (lambda) and various metrics related to model behavior, potentially in the context of reinforcement learning or agent-based modeling. Panel A and B are charts showing metric values as a function of λ. Panels C, D, and E are diagrams illustrating different behavioral regimes: Imitation, Intuition, and Hallucination, respectively.
### Components/Axes
**Panel A:**
* **X-axis:** λ (lambda), on a logarithmic scale. Marked with values approximately 10<sup>-3</sup>, 10<sup>-2</sup>, 10<sup>-1</sup>, 10<sup>0</sup>, 10<sup>1</sup>, 10<sup>2</sup>.
* **Y-axis:** Metric value, ranging from approximately 0.6 to 1.4.
* **Data Series:**
* ε<sub>λ</sub> (cross-entropy) - Red line with circular data points.
* H<sub>λ</sub> (path-entropy) - Blue line with circular data points.
* **Inset:** A smaller chart showing "Fluctuations" with λ on the x-axis (log scale) and a value 'b' on the y-axis, ranging from 0 to 0.05.
**Panel B:**
* **X-axis:** λ (lambda), on a logarithmic scale. Marked with values approximately 10<sup>-3</sup>, 10<sup>-2</sup>, 10<sup>-1</sup>, 10<sup>0</sup>, 10<sup>1</sup>, 10<sup>2</sup>.
* **Y-axis:** MFPT / WHR (normalized), ranging from approximately 0 to 1.
* **Data Series:**
* MFPT - Black line with circular data points.
* WHR - Red line with circular data points.
* P<sub>intuition</sub> - Teal shaded area.
**Panels C, D, E:**
* Each panel depicts a grid-like environment with a path highlighted in red.
* Panel C: Labeled "Imitation".
* Panel D: Labeled "Intuition".
* Panel E: Labeled "Hallucination".
### Detailed Analysis or Content Details
**Panel A:**
* The red line (ε<sub>λ</sub>) starts at approximately 0.75 at λ = 10<sup>-3</sup> and increases relatively steadily until approximately λ = 10<sup>0</sup>, where it reaches a peak of around 1.3. After this peak, it plateaus.
* The blue line (H<sub>λ</sub>) starts at approximately 0.7 at λ = 10<sup>-3</sup> and increases more rapidly than the red line, reaching a peak of around 1.25 at approximately λ = 10<sup>-1</sup>. It then decreases slightly and plateaus.
* The inset shows a curve with a peak around λ = 10<sup>-1</sup>, indicating fluctuations.
**Panel B:**
* The black line (MFPT) starts at approximately 0.4 at λ = 10<sup>-3</sup> and decreases steadily to approximately 0.1 at λ = 10<sup>0</sup>. It then remains relatively constant.
* The red line (WHR) starts at approximately 0.8 at λ = 10<sup>-3</sup> and remains relatively constant until approximately λ = 10<sup>-1</sup>, where it increases sharply to approximately 0.9.
* The teal shaded area (P<sub>intuition</sub>) is centered around λ = 10<sup>-1</sup> and represents a region of high intuition probability.
**Panels C, D, E:**
* **Panel C (Imitation):** The red path is relatively simple and follows the grid closely.
* **Panel D (Intuition):** The red path is more direct and efficient, taking shortcuts through the grid.
* **Panel E (Hallucination):** The red path is highly erratic and deviates significantly from the grid, with many loops and unnecessary turns. Multiple red lines are present, suggesting multiple possible paths.
### Key Observations
* Panel A shows that cross-entropy and path-entropy both increase with λ, but path-entropy reaches a peak and then plateaus.
* Panel B shows an inverse relationship between MFPT and WHR, with MFPT decreasing and WHR increasing as λ increases. The teal area highlights a region where intuition is high.
* The diagrams in Panels C, D, and E visually represent different levels of agent behavior, ranging from simple imitation to intuitive problem-solving to chaotic hallucination.
### Interpretation
The data suggests a transition in agent behavior as the parameter λ is varied. At low values of λ (Imitation), the agent follows a simple, grid-aligned path. As λ increases (Intuition), the agent begins to exhibit more efficient and direct behavior, suggesting an ability to learn and generalize. However, at higher values of λ (Hallucination), the agent's behavior becomes erratic and unpredictable, indicating a breakdown in its learning process.
The relationship between the metrics in Panels A and B provides insight into this transition. The increase in cross-entropy (ε<sub>λ</sub>) suggests increasing uncertainty in the agent's predictions, while the increase in path-entropy (H<sub>λ</sub>) suggests increasing exploration. The decrease in MFPT (Mean First Passage Time) indicates that the agent is finding shorter paths to its goal, while the increase in WHR (presumably a measure of path width or complexity) suggests that the agent is exploring a wider range of possibilities.
The teal shaded area in Panel B, representing P<sub>intuition</sub>, highlights a region where the agent is most likely to exhibit intuitive behavior. This region corresponds to a balance between exploration and exploitation, where the agent is able to leverage its learned knowledge to solve problems efficiently. The fluctuations shown in the inset of Panel A may represent the inherent stochasticity of the learning process. The outlier behavior in Panel E suggests a potential overfitting or instability in the model.