TECHNICAL ASSET FINGERPRINT
8ff4f0c9ea9ab7b871a4c71c
Click to view fullscreen
Press ESC or click to close
FOUND IN PAPERS
EXPERT: healer-alpha-free VERSION 1
RUNTIME: free/openrouter/healer-alpha
INTEL_VERIFIED
## [Multi-Panel Scientific Figure]: Analysis of Entropy, Performance Metrics, and Behavioral Strategies in a Parameterized System
### Overview
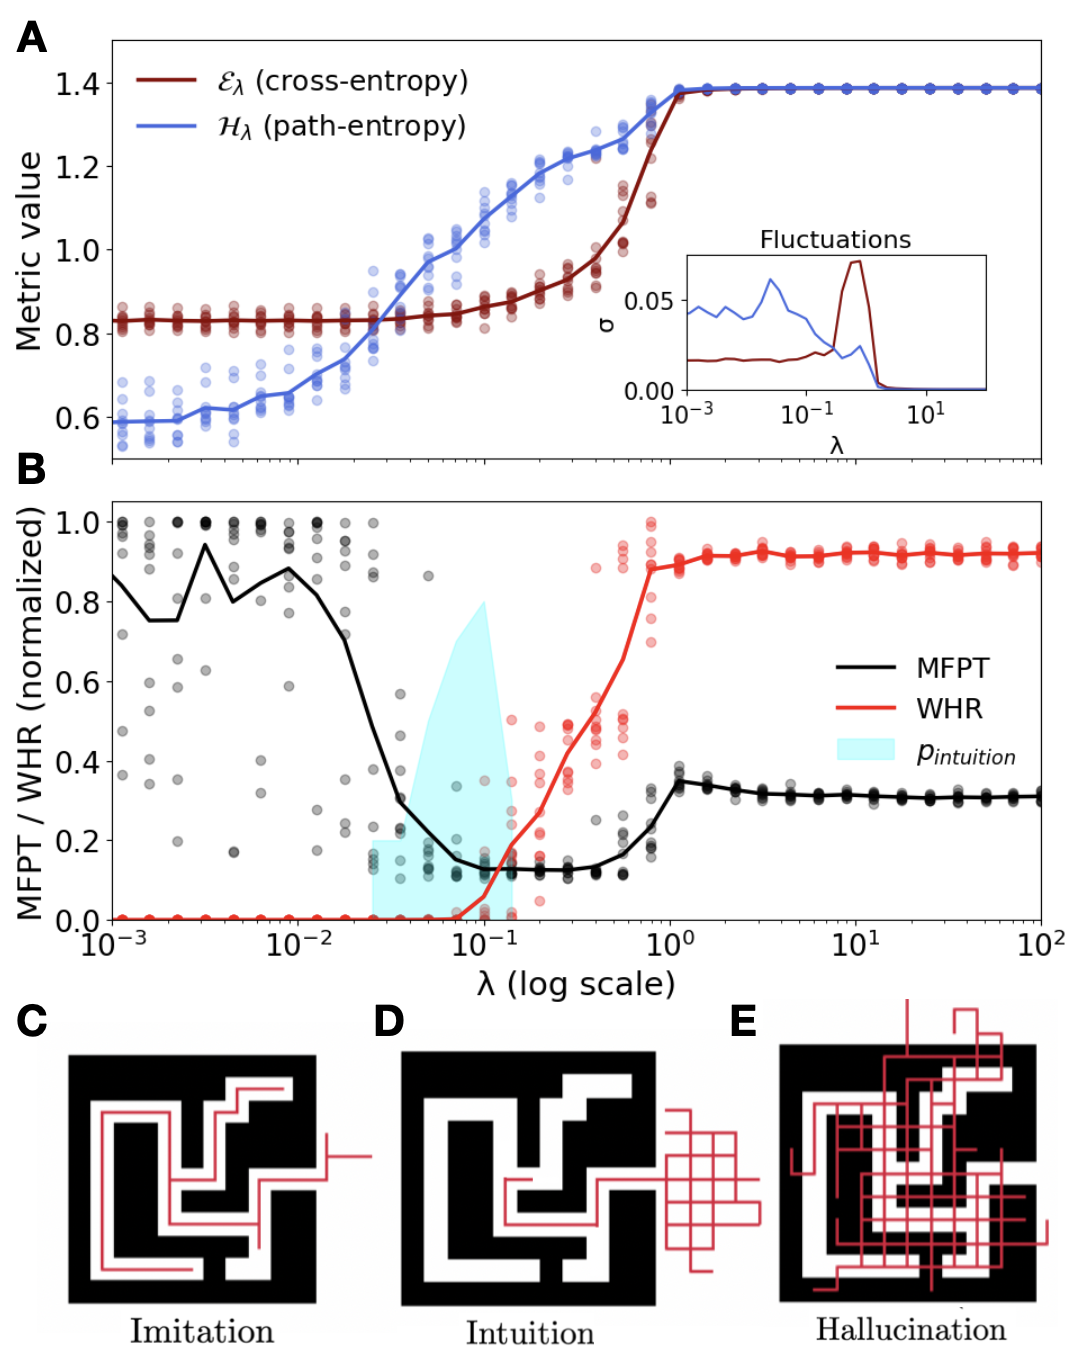
The image is a composite scientific figure containing five panels (A-E). Panels A and B are quantitative plots showing how different metrics change as a function of a parameter λ (lambda) on a logarithmic scale. Panels C, D, and E are schematic diagrams illustrating three distinct behavioral strategies ("Imitation," "Intuition," "Hallucination") within a maze-like environment, likely corresponding to different regimes of the parameter λ.
### Components/Axes
**Panel A (Top Chart):**
* **Type:** Line chart with scatter data points and an inset line chart.
* **X-axis:** Label: `λ` (lambda). Scale: Logarithmic, ranging from approximately `10^-3` to `10^1`.
* **Y-axis:** Label: `Metric value`. Scale: Linear, from `0.6` to `1.4`.
* **Legend (Top-Left):**
* `E_λ (cross-entropy)`: Represented by a dark red line and data points.
* `H_λ (path-entropy)`: Represented by a blue line and data points.
* **Inset (Bottom-Right of Panel A):**
* **Title:** `Fluctuations`
* **X-axis:** `λ` (log scale, same range as main plot).
* **Y-axis:** `σ` (sigma, likely standard deviation). Scale: Linear, from `0.00` to `0.05`.
* **Data:** Two lines corresponding to the main legend colors (red for cross-entropy fluctuations, blue for path-entropy fluctuations).
**Panel B (Middle Chart):**
* **Type:** Line chart with scatter data points and a shaded region.
* **X-axis:** Label: `λ (log scale)`. Scale: Logarithmic, ranging from `10^-3` to `10^2`.
* **Y-axis:** Label: `MFPT / WHR (normalized)`. Scale: Linear, from `0.0` to `1.0`.
* **Legend (Center-Right):**
* `MFPT`: Represented by a black line and data points.
* `WHR`: Represented by a red line and data points.
* `P_intuition`: Represented by a light blue shaded area.
* **Data Series:**
* **MFPT (Black):** Starts high (~0.85 at λ=10^-3), shows a sharp dip to a minimum (~0.12) around λ=10^-1, then rises to a plateau (~0.32) for λ > 10^0.
* **WHR (Red):** Starts at 0.0 for low λ, begins rising sharply around λ=10^-1, and plateaus near 0.92 for λ > 10^0.
* **P_intuition (Light Blue Shaded):** A region that peaks between λ ≈ 3x10^-2 and λ ≈ 2x10^-1, with its maximum height around 0.8 on the y-axis.
**Panels C, D, E (Bottom Diagrams):**
* **Type:** Schematic diagrams of a maze (black walls on white background) with overlaid red paths.
* **Labels (Below each diagram):**
* **C:** `Imitation`
* **D:** `Intuition`
* **E:** `Hallucination`
* **Visual Content:**
* **C (Imitation):** Shows a single, clean, efficient red path navigating the maze from a start point (left) to an end point (right).
* **D (Intuition):** Shows a primary efficient path similar to C, but also includes a faint, grid-like exploration pattern (red lines) in the open area to the right of the maze exit.
* **E (Hallucination):** Shows a dense, chaotic network of red paths covering almost the entire maze area, indicating extensive, non-efficient exploration or "hallucinated" paths.
### Detailed Analysis
**Panel A Trends:**
1. **Path-Entropy (H_λ, Blue):** Shows a clear sigmoidal increase. It starts low (~0.6) at λ=10^-3, rises steadily through the middle range (λ=10^-2 to 10^0), and saturates at a high value (~1.4) for λ > 10^0. The trend is "upward sloping" before plateauing.
2. **Cross-Entropy (E_λ, Red):** Remains relatively constant and low (~0.83) for λ < 10^-1. It then increases sharply, converging with the path-entropy line at the saturation point (~1.4) for λ > 10^0. The trend is "flat then sharply upward."
3. **Crossover:** The two lines cross at approximately λ ≈ 0.2. Before this point, cross-entropy is higher than path-entropy; after, path-entropy is higher until they converge.
4. **Inset Fluctuations (σ):** Fluctuations in path-entropy (blue) are higher at low λ and decrease. Fluctuations in cross-entropy (red) show a distinct peak around λ ≈ 0.5, indicating a region of high variability in this metric.
**Panel B Trends:**
1. **MFPT (Black):** The "Mean First Passage Time" (a performance metric, lower is better) shows a non-monotonic trend. It is high (poor performance) at very low λ, reaches an optimal minimum (best performance) at an intermediate λ (~0.1), and then degrades again (increases) at high λ before stabilizing.
2. **WHR (Red):** The "Wrong Head Ratio" (an error metric, lower is better) is near zero for low λ, indicating correct behavior. It begins to increase dramatically in the same intermediate λ range where MFPT is optimal, and saturates at a high error rate (~0.92) for high λ.
3. **P_intuition (Shaded):** The probability or prevalence of "intuition" is localized to the intermediate λ range (approx. 0.03 to 0.2), peaking where MFPT is lowest and WHR is beginning to rise.
**Panel C-E Correspondence:**
* **Imitation (C):** Corresponds to **low λ** (left side of plots). Behavior is rigid, efficient, and error-free (low WHR), but may be slow (higher MFPT). Path-entropy is low.
* **Intuition (D):** Corresponds to **intermediate λ** (where `P_intuition` peaks). Behavior combines efficient goal-directed paths with some exploratory "intuition," leading to optimal speed (lowest MFPT) but the onset of errors (rising WHR). Path-entropy is increasing.
* **Hallucination (E):** Corresponds to **high λ** (right side of plots). Behavior is chaotic, inefficient (high MFPT), and highly erroneous (high WHR). Path-entropy is saturated at its maximum.
### Key Observations
1. **Phase Transition:** There is a clear phase transition around λ ≈ 0.1-1.0. All metrics (entropies, performance, error) change dramatically in this region.
2. **Performance-Error Trade-off:** The optimal performance (minimum MFPT) occurs precisely in the region where errors (WHR) begin to increase, suggesting a fundamental trade-off between speed and accuracy controlled by λ.
3. **Entropy as an Order Parameter:** Path-entropy (H_λ) acts as a smooth order parameter describing the system's transition from ordered (low entropy, imitation) to disordered (high entropy, hallucination).
4. **Fluctuation Peak:** The peak in cross-entropy fluctuations (inset, Panel A) near the transition point is a classic signature of a critical phase transition.
### Interpretation
This figure likely describes a **computational or cognitive model** where a parameter λ controls the balance between **exploitation** (following known, efficient paths) and **exploration** (trying new, random paths).
* **Low λ (Imitation Regime):** The system rigidly imitates a known optimal policy. This is safe (zero errors, low WHR) and produces low path-entropy, but may be sub-optimal in speed (higher MFPT) if the policy isn't perfectly adapted to the current context.
* **Intermediate λ (Intuition Regime):** The system blends exploitation with directed exploration. This "intuitive" exploration allows it to find faster routes (minimizing MFPT) but introduces the risk of errors (increasing WHR). This is the regime of optimal *performance* but not optimal *accuracy*. The shaded `P_intuition` region highlights this critical, adaptive zone.
* **High λ (Hallucination Regime):** The system engages in excessive, undirected exploration. This leads to very high path-entropy, poor performance (high MFPT due to wasted effort), and a very high error rate (high WHR), as the system "hallucinates" paths that do not lead to the goal.
**The Peircean Insight:** The data suggests λ modulates the system's **abductive reasoning** capacity. Low λ relies on deduction from a fixed rule (imitation). Intermediate λ allows for creative abduction—forming useful hypotheses about new paths (intuition). High λ degenerates into random guessing or overfitting to noise (hallucination). The trade-off between MFPT and WHR is the cost of this creative process. The figure argues that peak performance in complex environments requires operating near a critical point of controlled disorder, where exploration is maximized just before it becomes counterproductive chaos.
DECODING INTELLIGENCE...