## Line Graph and Scatter Plot with Maze Diagrams: Metric Analysis Across Strategies
### Overview
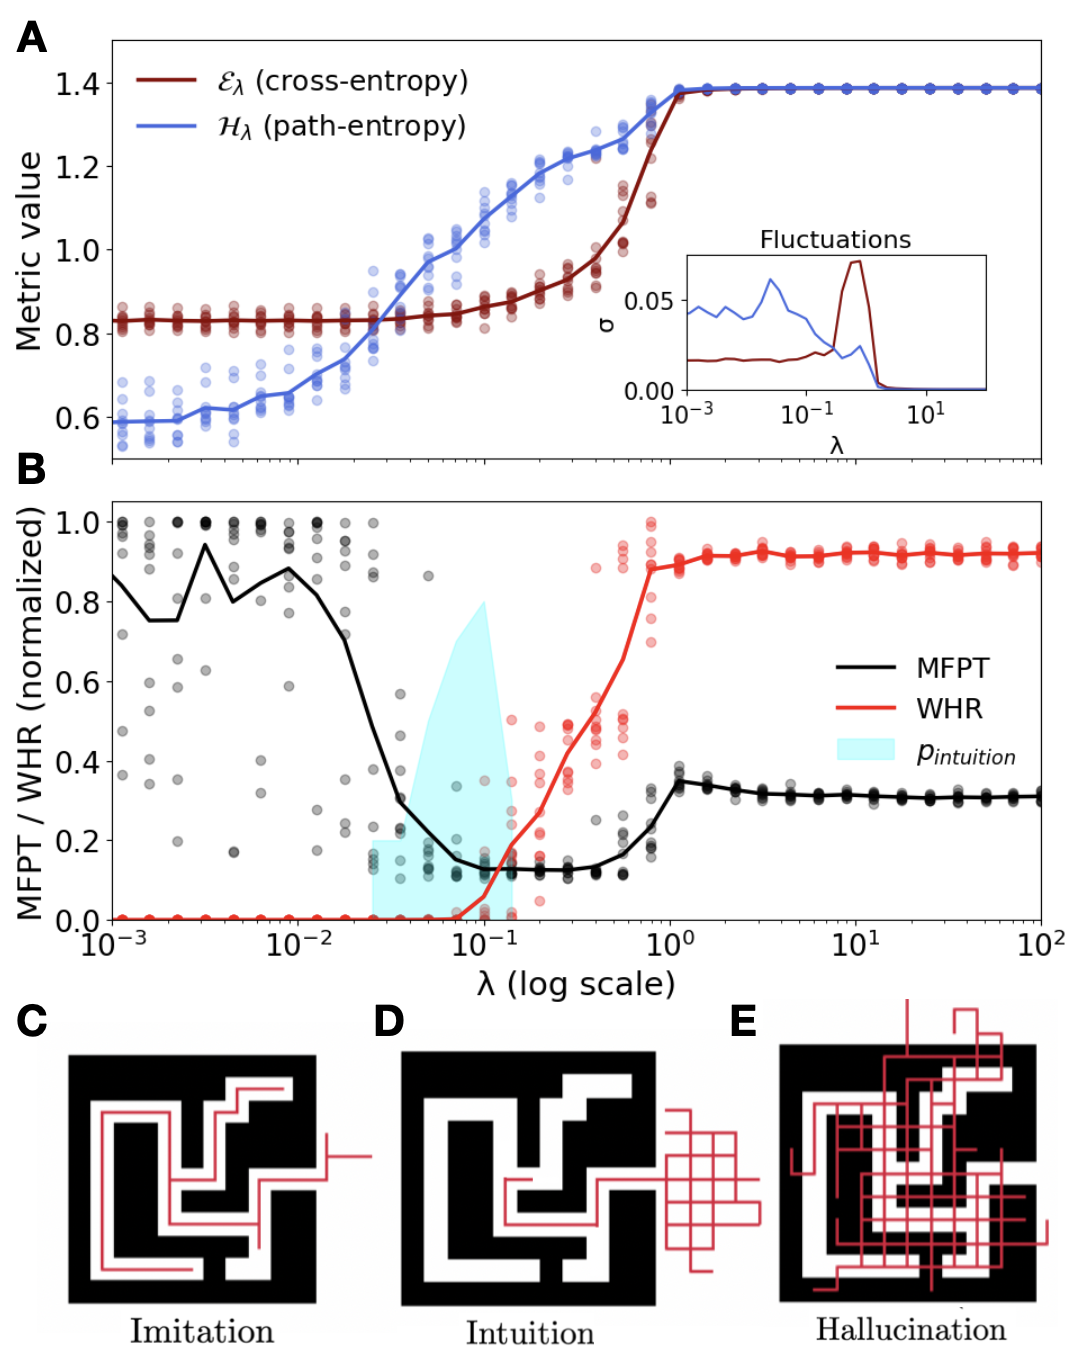
The image contains three primary components:
1. **Section A**: A line graph comparing cross-entropy (Eλ) and path-entropy (Hλ) across a logarithmic λ scale.
2. **Section B**: A scatter plot comparing normalized MFPT/WHR values against λ, with a shaded region labeled *p_intuition*.
3. **Sections C-E**: Three maze diagrams labeled "Imitation," "Intuition," and "Hallucination," showing increasing path complexity.
---
### Components/Axes
#### Section A (Line Graph)
- **X-axis**: λ (log scale, 10⁻³ to 10¹)
- **Y-axis**: Metric value (0.0 to 1.4)
- **Legend**:
- Red line: Eλ (cross-entropy)
- Blue line: Hλ (path-entropy)
- **Inset**: Fluctuations in Eλ and Hλ around λ=0.1 (log scale: 10⁻³ to 10¹).
#### Section B (Scatter Plot)
- **X-axis**: λ (log scale, 10⁻³ to 10²)
- **Y-axis**: MFPT/WHR (normalized, 0.0 to 1.0)
- **Legend**:
- Black line: MFPT (Mean First Passage Time)
- Red line: WHR (Worst-Hit Ratio)
- Blue shaded region: *p_intuition* (peak at λ=0.1)
#### Sections C-E (Diagrams)
- **Labels**:
- C: Imitation (sparse red paths)
- D: Intuition (grid-like red paths)
- E: Hallucination (dense, chaotic red paths)
---
### Detailed Analysis
#### Section A
- **Eλ (red)**:
- Starts flat (~0.8) for λ < 0.1.
- Sharp increase to ~1.4 at λ=1.0, then plateaus.
- **Hλ (blue)**:
- Gradual rise from ~0.6 to ~1.2 at λ=1.0, then stabilizes.
- **Inset**:
- Fluctuations peak at λ=0.1 (log scale), with Eλ showing sharper oscillations than Hλ.
#### Section B
- **MFPT (black)**:
- Decreases to ~0.4 at λ=0.1, then rises to ~0.8 at λ=10.
- **WHR (red)**:
- Increases from ~0.2 to ~0.9 at λ=10, then plateaus.
- **p_intuition (blue)**:
- Peaks at λ=0.1 (~0.6), then declines.
#### Sections C-E
- **Imitation (C)**:
- Minimal red paths; simple, direct routes.
- **Intuition (D)**:
- Grid-like red paths; moderate complexity.
- **Hallucination (E)**:
- Dense, overlapping red paths; chaotic structure.
---
### Key Observations
1. **λ=0.1 (log scale)**:
- Both Eλ and Hλ show fluctuations (inset A).
- p_intuition peaks, suggesting optimal intuition at this λ.
2. **λ > 1.0**:
- Eλ and Hλ plateau, indicating diminishing returns.
- MFPT/WHR trends stabilize, but WHR remains high.
3. **Diagram Progression**:
- Path complexity increases from Imitation (C) to Hallucination (E), correlating with λ-dependent metric changes.
---
### Interpretation
- **Metrics and λ**:
- Cross-entropy (Eλ) is more sensitive to λ changes than path-entropy (Hλ), suggesting stronger dependence on path variability.
- The peak in *p_intuition* at λ=0.1 implies intuition is most effective at intermediate λ values.
- **Diagrams and Strategies**:
- Imitation (C) aligns with low λ (simple paths), while Hallucination (E) matches high λ (complex paths).
- Intuition (D) bridges the two, reflecting balanced path exploration.
- **Anomalies**:
- WHR remains elevated even as λ increases, indicating persistent worst-case performance despite metric stabilization.
This analysis highlights the interplay between λ, path complexity, and performance metrics, with intuition emerging as a critical strategy at intermediate λ values.