## Screenshot: Control Interface with Grid Simulation
### Overview
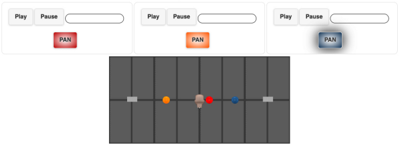
The image depicts a user interface with three control panels at the top and a grid-based simulation area below. The panels contain interactive buttons and sliders, while the grid features colored dots and a central object, suggesting a dynamic system for tracking or manipulating elements.
### Components/Axes
1. **Top Panels (Left to Right):**
- **Left Panel:**
- **Buttons:** "Play" (gray), "Pause" (gray), "PAN" (red).
- **Slider:** Empty, no numerical markings.
- **Middle Panel:**
- **Buttons:** "Play" (gray), "Pause" (gray), "PAN" (orange).
- **Slider:** Empty, no numerical markings.
- **Right Panel:**
- **Buttons:** "Play" (gray), "Pause" (gray), "PAN" (blue).
- **Slider:** Empty, no numerical markings.
- **Legend:** No explicit legend, but "PAN" button colors (red, orange, blue) likely correspond to colored dots in the grid.
2. **Grid Area:**
- **Structure:** Dark gray grid with 6 vertical lanes (separated by thin black lines) and horizontal lines dividing the space into segments.
- **Elements:**
- **Colored Dots:**
- Yellow dot in lane 2.
- Red dot in lane 3.
- Blue dot in lane 4.
- **Central Object:** A gray, irregularly shaped object centered between lanes 3 and 4.
- **Markers:** Two gray rectangular markers at the edges of lanes 1 and 5.
### Detailed Analysis
- **Control Panels:**
- Each panel has identical "Play" and "Pause" buttons, suggesting they control playback of the simulation. The "PAN" buttons differ in color (red, orange, blue), likely mapping to the colored dots in the grid (yellow, red, blue). The absence of numerical sliders implies manual control rather than quantitative adjustment.
- **Grid Simulation:**
- The grid’s vertical lanes (6 total) and horizontal dividers suggest a track or pathway system. The colored dots (yellow, red, blue) may represent entities or data points, while the central object could be a movable agent or cursor. The gray markers at lanes 1 and 5 might indicate boundaries or reference points.
### Key Observations
1. **Color Mapping:** The "PAN" button colors (red, orange, blue) do not directly match the grid’s colored dots (yellow, red, blue). This discrepancy suggests either a design inconsistency or a potential misalignment in the interface’s logic.
2. **Central Object:** The irregularly shaped central object is positioned between lanes 3 and 4, overlapping the red and blue dots. Its purpose is unclear but may relate to interaction with the colored dots.
3. **Empty Sliders:** The lack of numerical markings on sliders indicates they may function as toggle switches or qualitative controls rather than quantitative adjustments.
### Interpretation
The interface appears to simulate a dynamic system where users can control playback ("Play"/"Pause") and manipulate the position or perspective ("PAN") of entities represented by colored dots. The central object’s placement and interaction with the grid suggest it may act as a focal point or cursor for selecting or moving elements. The mismatch between "PAN" button colors and grid dots raises questions about the interface’s design logic, potentially indicating a bug or incomplete implementation. The absence of numerical data implies the system prioritizes qualitative interaction over quantitative analysis.