\n
## Diagram: Control Interface with Visualization
### Overview
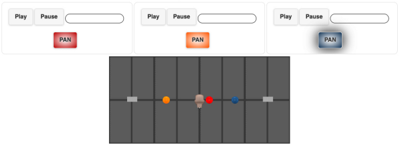
The image depicts a control interface with three sets of "Play/Pause/Pan" buttons positioned above a grid-like visualization. The visualization contains four colored circles, likely representing tracked objects or data points, arranged within the grid. The interface appears to control the visualization, potentially allowing for playback, pausing, and panning across the grid.
### Components/Axes
The image consists of the following components:
* **Control Buttons:** Three sets of buttons, each containing "Play", "Pause", and "Pan" options.
* **Visualization Grid:** A dark gray grid composed of vertical rectangles.
* **Tracked Objects:** Four colored circles (orange, red, blue, and a lighter brown/beige) positioned within the grid.
* **Sliders:** Three horizontal sliders are positioned below the "Play" and "Pause" buttons.
The grid itself does not have explicit axes labels, but it appears to represent a coordinate space.
### Detailed Analysis or Content Details
The image shows three identical control sets arranged horizontally. Each set has:
* A "Play" button.
* A "Pause" button.
* A "Pan" button. The "Pan" buttons are colored differently: red, orange, and a light blue.
The visualization grid is composed of approximately 10 vertical columns. The four colored circles are positioned as follows (approximate relative positions):
* **Orange Circle:** Located approximately 2 columns from the left edge.
* **Red Circle:** Located approximately 5 columns from the left edge, and centered vertically.
* **Blue Circle:** Located approximately 8 columns from the left edge.
* **Beige/Brown Circle:** Located approximately 4 columns from the left edge.
The sliders are positioned below the "Play" and "Pause" buttons. They appear to be inactive or at their minimum value.
### Key Observations
* The different colors of the "Pan" buttons suggest different panning modes or directions.
* The positioning of the circles within the grid may represent their coordinates or locations.
* The sliders likely control some aspect of the visualization or the tracked objects.
* The interface appears to be designed for interactive control of the visualization.
### Interpretation
This image likely represents a user interface for a tracking or monitoring system. The grid could represent a physical space, a data space, or a simulation environment. The colored circles represent objects or data points being tracked within that space. The "Play/Pause" buttons control the animation or progression of the tracking, while the "Pan" buttons allow the user to navigate the visualization. The sliders likely control parameters such as speed, zoom, or other relevant settings.
The differing colors of the "Pan" buttons suggest that different panning modes are available, potentially allowing the user to pan in specific directions or focus on particular areas of the grid. The interface is designed for interactive exploration and analysis of the tracked objects or data.
The image does not provide any quantitative data or specific values, but it conveys the functionality and layout of a control system. It is a visual representation of a system designed for observation and manipulation of data within a defined space.