# Technical Document Analysis: Bar Chart
## Chart Type
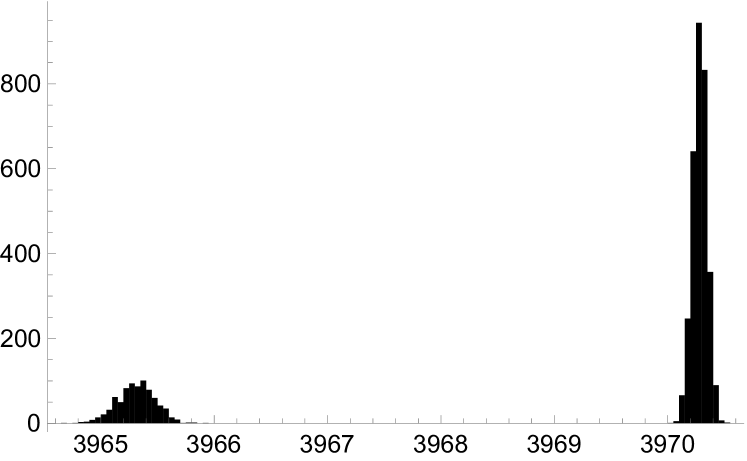
- **Bar Chart** with vertical bars representing data points.
## Axes
- **X-Axis (Horizontal)**:
- **Label**: Not explicitly labeled.
- **Categories**: Years `3965`, `3966`, `3967`, `3968`, `3969`, `3970`.
- **Spacing**: Evenly distributed across the axis.
- **Y-Axis (Vertical)**:
- **Label**: Not explicitly labeled.
- **Range**: `0` to `800`, with increments of `200`.
- **Units**: Numerical values (no explicit units provided).
## Data Points
1. **Bar at `3965`**:
- **Height**: Approximately `100` on the Y-axis.
- **Position**: Leftmost bar, centered over `3965`.
2. **Bar at `3970`**:
- **Height**: Approximately `900` on the Y-axis.
- **Position**: Rightmost bar, centered over `3970`.
3. **Years `3966`–`3969`**:
- **Bars**: No visible bars; no data represented.
## Trends
- **Primary Trend**: A significant increase in the data value from `3965` to `3970`.
- Value rises from ~`100` to ~`900`, a **800-unit increase**.
- **Secondary Trend**: No data points for intermediate years (`3966`–`3969`).
## Visual Details
- **Bars**: Black, rectangular, with no shading or gradients.
- **Background**: White, with no gridlines or annotations.
- **Spacing**: Consistent gaps between bars and axis labels.
## Notes
- No legend, text blocks, or additional annotations present.
- The chart focuses on two discrete data points with a stark contrast in magnitude.