## Scatter Plot: Accuracy vs. Time-to-Answer (Longest in Thousands)
### Overview
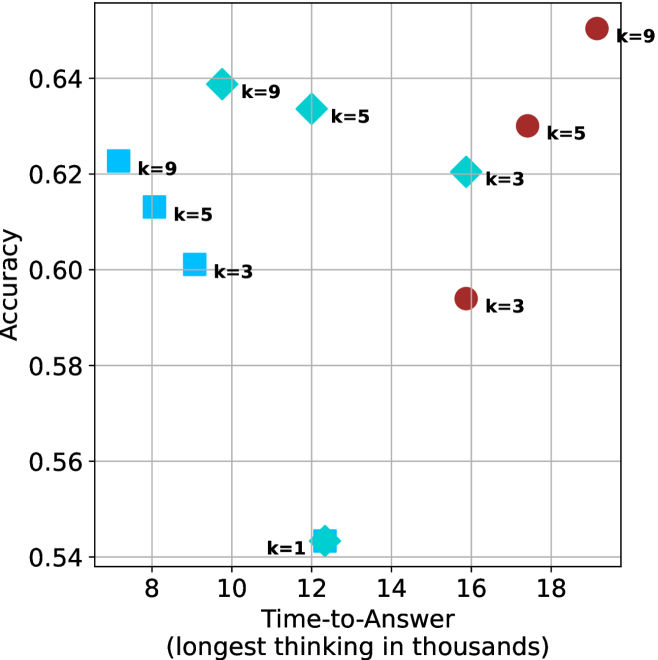
The image is a scatter plot comparing **Accuracy** (y-axis) against **Time-to-Answer (longest in thousands)** (x-axis). Data points are color-coded and labeled with "k" values (k=9, k=5, k=3, k=1). The plot includes a legend on the right and gridlines for reference.
---
### Components/Axes
- **X-axis (Time-to-Answer)**: Labeled "Time-to-Answer (longest in thousands)", scaled from 8 to 18 (in thousands).
- **Y-axis (Accuracy)**: Labeled "Accuracy", scaled from 0.54 to 0.64.
- **Legend**: Located on the right, mapping colors to "k" values:
- **Blue**: k=9
- **Cyan**: k=5
- **Red**: k=3
- **Light Blue (Star)**: k=1
- **Data Points**: Each point is annotated with its "k" value (e.g., "k=9", "k=5") near its position.
---
### Detailed Analysis
#### Data Points (Approximate Coordinates):
1. **k=9 (Blue)**:
- (8, 0.62)
- (10, 0.64)
2. **k=5 (Cyan)**:
- (10, 0.64)
- (14, 0.62)
3. **k=3 (Red)**:
- (16, 0.59)
- (18, 0.63)
4. **k=1 (Light Blue Star)**:
- (12, 0.54)
#### Trends:
- **k=9 (Blue)**: Highest accuracy (0.62–0.64) at moderate time-to-answer (8–10k).
- **k=5 (Cyan)**: Slightly lower accuracy (0.62–0.64) at higher time-to-answer (10–14k).
- **k=3 (Red)**: Lower accuracy (0.59–0.63) at the highest time-to-answer (16–18k).
- **k=1 (Light Blue Star)**: Lowest accuracy (0.54) at 12k time-to-answer.
---
### Key Observations
1. **Highest Accuracy**: Achieved by **k=9** at 10k time-to-answer (0.64).
2. **Lowest Accuracy**: **k=1** at 12k time-to-answer (0.54).
3. **Inverse Relationship**: Higher "k" values generally correlate with higher accuracy, but exceptions exist (e.g., k=3 at 18k has 0.63 vs. k=5 at 14k with 0.62).
4. **Time-to-Answer Variability**: No strict monotonic relationship between time-to-answer and accuracy.
---
### Interpretation
The data suggests a **positive correlation between "k" values and accuracy**, but the relationship is not linear. Higher "k" values (e.g., k=9) achieve higher accuracy, while lower "k" values (e.g., k=1) perform poorly. However, **time-to-answer does not strictly increase with accuracy**:
- **k=9** achieves high accuracy (0.64) at both 8k and 10k time-to-answer.
- **k=3** achieves moderate accuracy (0.63) at 18k time-to-answer, outperforming **k=5** at 14k (0.62).
The **k=1** outlier (0.54 accuracy) highlights a potential threshold effect, where very low "k" values degrade performance. The plot implies that **optimizing "k" balances accuracy and computational cost**, with diminishing returns at higher "k" values.
---
### Critical Notes
- **Color Consistency**: All data points match their legend labels (e.g., red = k=3).
- **Spatial Grounding**: Legend is positioned on the right, avoiding overlap with data points.
- **Trend Verification**: Visual inspection confirms that higher "k" values cluster in the upper-right quadrant (higher accuracy, higher time-to-answer), but exceptions exist.