## Stacked Area Chart: Ecosystem Job Trends Over Time
### Overview
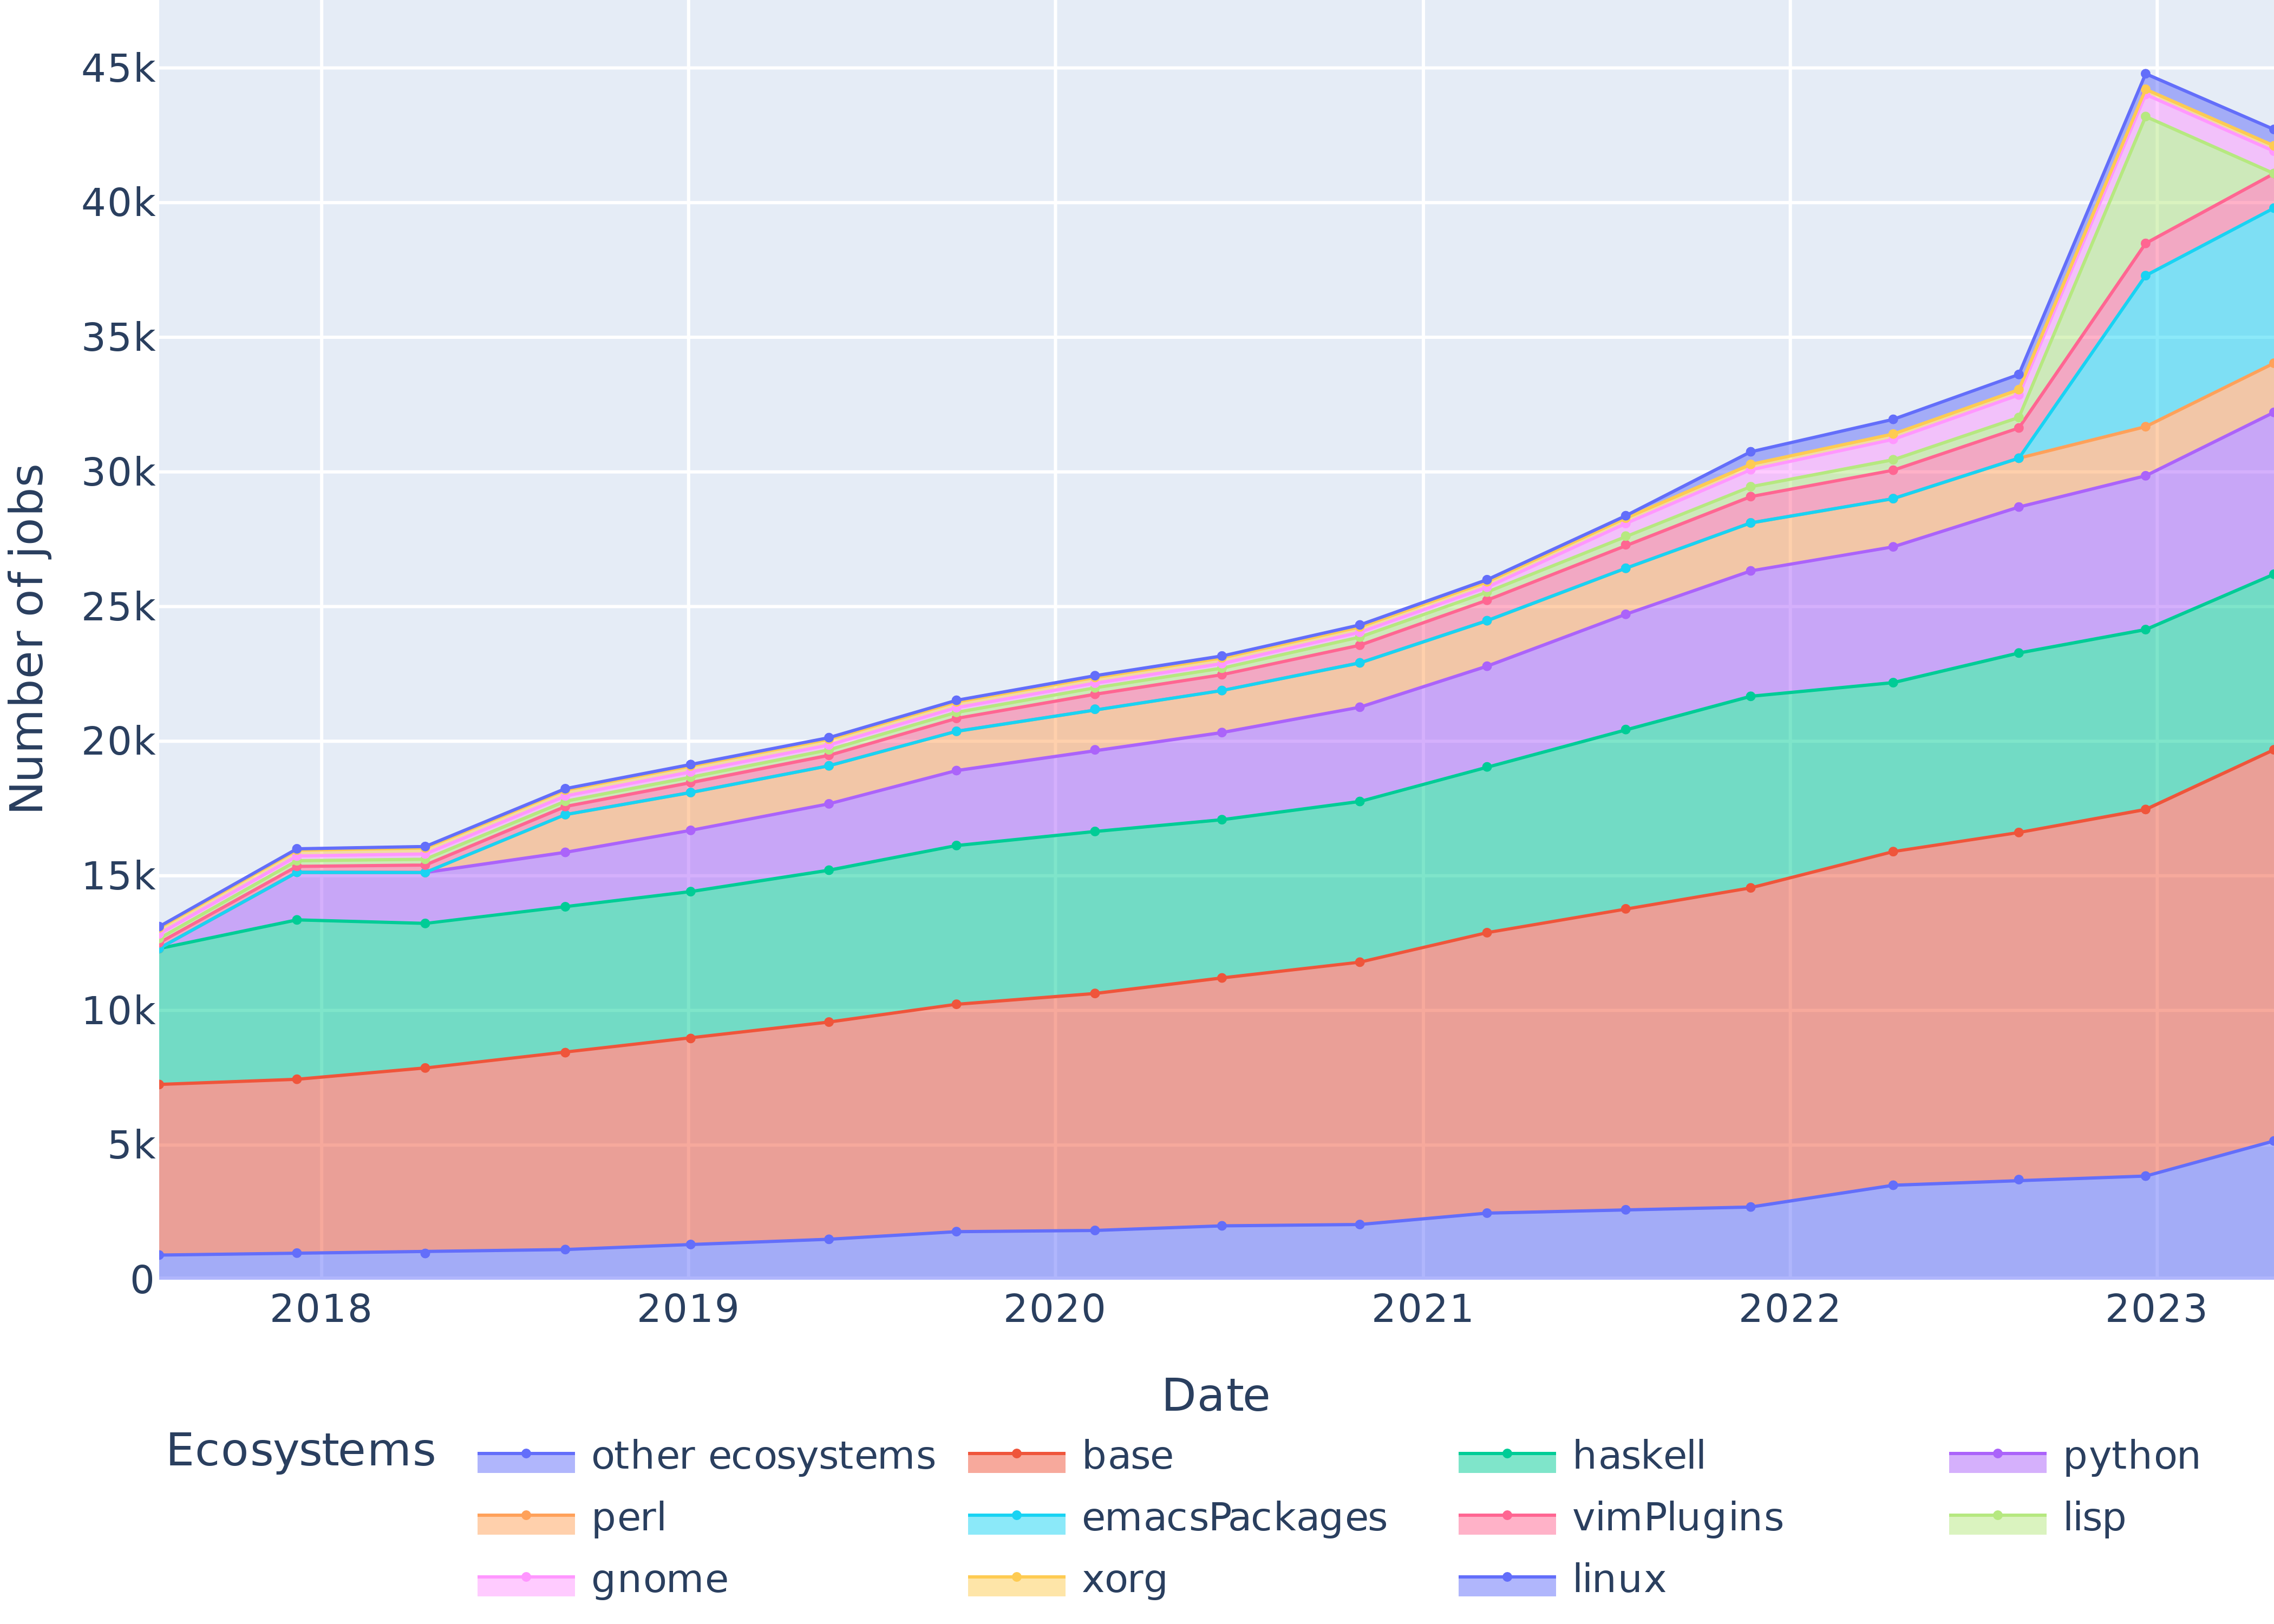
The image is a stacked area chart illustrating the number of jobs associated with various programming ecosystems over time, from 2018 to 2023. The chart displays the trends for each ecosystem, showing how the job market for each has evolved over the years.
### Components/Axes
* **Title:** Implicit, but the chart represents "Ecosystem Job Trends Over Time"
* **X-axis:** Date, ranging from 2018 to 2023 in yearly increments.
* **Y-axis:** Number of jobs, ranging from 0 to 45k in increments of 5k.
* **Legend:** Located at the bottom of the chart, listing the ecosystems and their corresponding colors:
* other ecosystems (blue)
* base (red)
* haskell (green)
* perl (orange)
* emacsPackages (cyan)
* vimPlugins (pink)
* gnome (light pink)
* xorg (yellow)
* python (purple)
* lisp (light green)
* linux (light blue)
### Detailed Analysis
Here's a breakdown of each ecosystem's trend:
* **other ecosystems (blue):** Starts at approximately 1k in 2018 and gradually increases to approximately 5k in 2023.
* **base (red):** Starts at approximately 7k in 2018 and increases to approximately 18k in 2023.
* **haskell (green):** Starts at approximately 5k in 2018 and increases to approximately 7k in 2023.
* **perl (orange):** Starts at approximately 3k in 2018 and increases to approximately 5k in 2023.
* **emacsPackages (cyan):** Starts at approximately 2k in 2018 and increases to approximately 12k in 2023.
* **vimPlugins (pink):** Starts at approximately 1k in 2018 and increases to approximately 3k in 2023.
* **gnome (light pink):** Starts at approximately 1k in 2018 and increases to approximately 2k in 2023.
* **xorg (yellow):** Starts at approximately 1k in 2018 and remains relatively stable around 1k in 2023.
* **python (purple):** Starts at approximately 3k in 2018 and increases to approximately 10k in 2023.
* **lisp (light green):** Starts at approximately 1k in 2018 and remains relatively stable around 1k in 2023.
* **linux (light blue):** Starts at approximately 1k in 2018 and increases to approximately 3k in 2023.
### Key Observations
* **Overall Growth:** Most ecosystems show an upward trend in the number of jobs from 2018 to 2023.
* **Significant Growth:** emacsPackages (cyan) and base (red) show the most significant growth in job numbers.
* **Stable Ecosystems:** xorg (yellow) and lisp (light green) remain relatively stable over the period.
* **Dominant Ecosystems:** base (red) and haskell (green) consistently represent a larger portion of the job market compared to other ecosystems.
### Interpretation
The data suggests that the job market for most programming ecosystems has grown between 2018 and 2023. The ecosystems with the most significant growth, such as emacsPackages and base, indicate increasing demand for skills related to these technologies. The stable ecosystems, like xorg and lisp, may indicate a consistent but not expanding demand. The stacked nature of the chart allows for a comparison of the relative size of each ecosystem's job market over time, highlighting the dominance of base and haskell. The trends observed could be influenced by factors such as the adoption of new technologies, the popularity of specific programming languages, and the overall growth of the software development industry.