## Stacked Area Chart: Job Growth Across Ecosystems (2018-2023)
### Overview
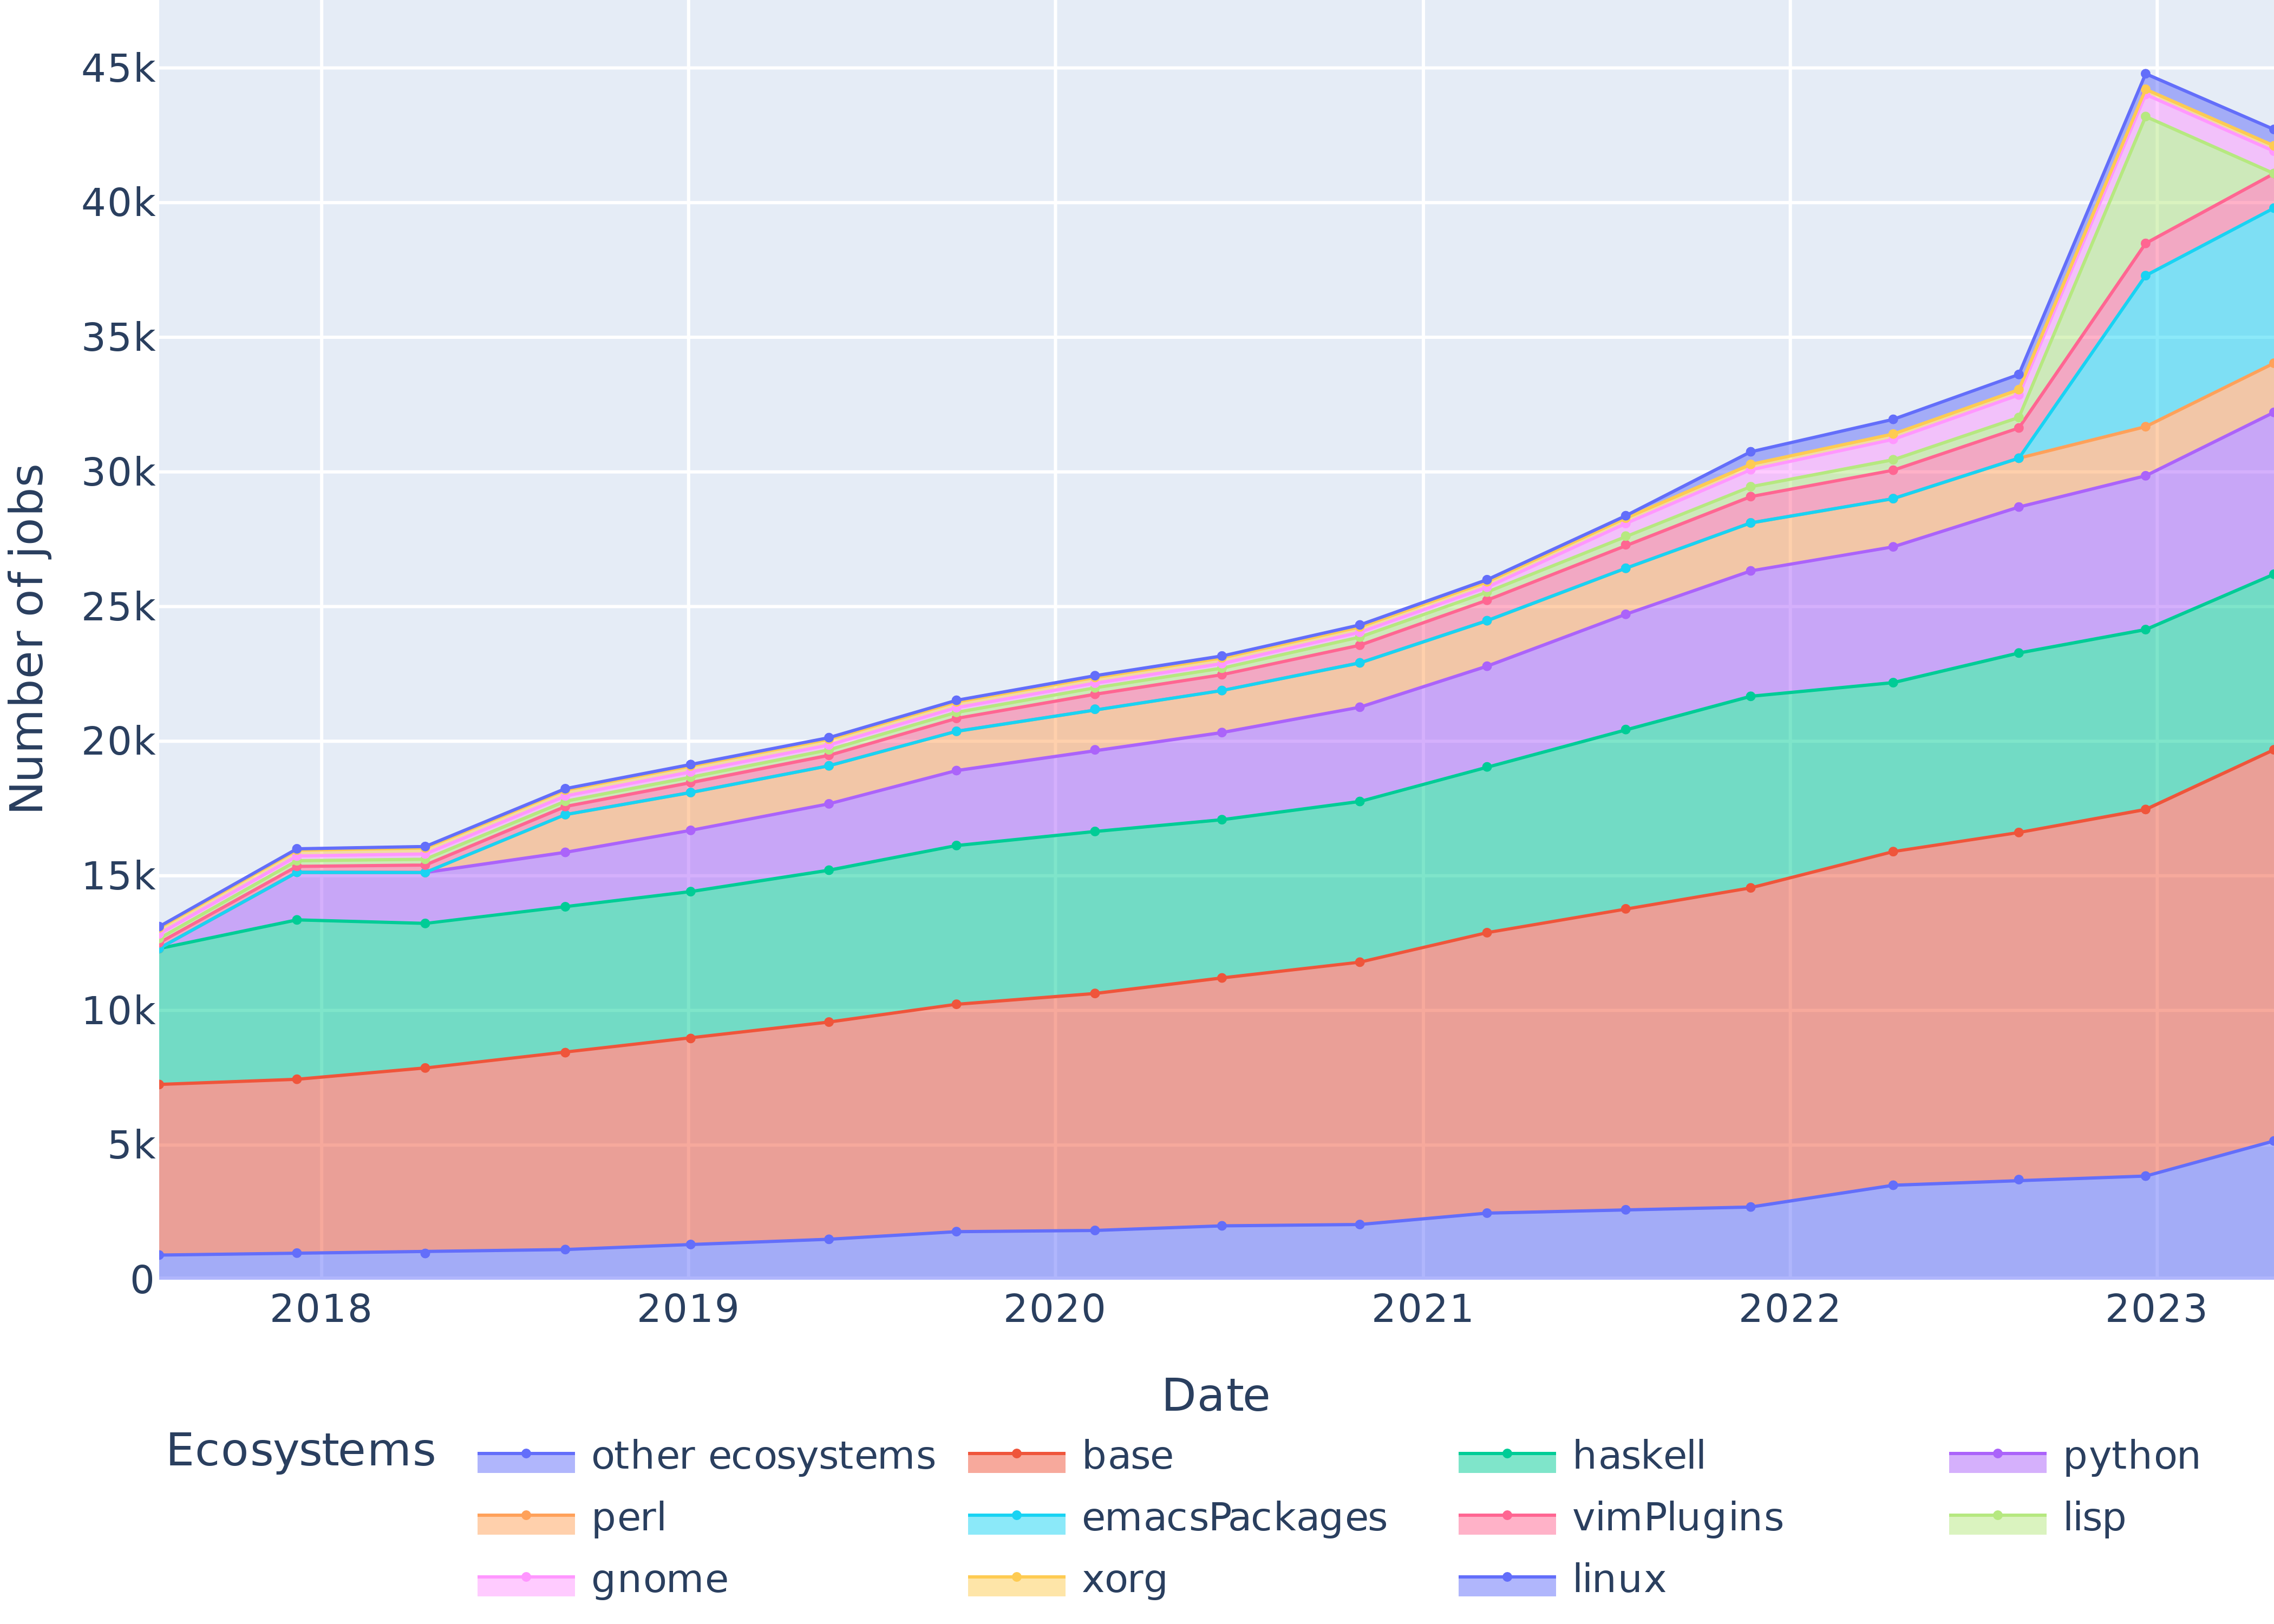
The chart visualizes the cumulative growth of jobs across eight technology ecosystems from 2018 to 2023. The y-axis represents the number of jobs (in thousands), while the x-axis spans five years. Each ecosystem is represented by a distinct color, with values stacked vertically to show total job growth over time.
### Components/Axes
- **X-axis (Date)**: Labeled "Date" with annual markers from 2018 to 2023.
- **Y-axis (Number of jobs)**: Labeled "Number of jobs" with increments of 5,000 up to 45,000.
- **Legend**:
- **Base** (red)
- **Haskell** (green)
- **Python** (purple)
- **VimPackages** (pink)
- **EmacsPackages** (cyan)
- **Xorg** (orange)
- **Lisp** (light green)
- **Other ecosystems** (blue)
### Detailed Analysis
1. **Base Ecosystem (Red)**:
- **2018**: ~7,000 jobs
- **2019**: ~9,000 jobs
- **2020**: ~11,000 jobs
- **2021**: ~13,000 jobs
- **2022**: ~16,000 jobs
- **2023**: ~20,000 jobs
- **Trend**: Steady linear growth with no plateaus.
2. **Haskell (Green)**:
- **2018**: ~5,000 jobs
- **2019**: ~6,000 jobs
- **2020**: ~7,000 jobs
- **2021**: ~8,000 jobs
- **2022**: ~10,000 jobs
- **2023**: ~14,000 jobs
- **Trend**: Accelerated growth post-2021.
3. **Python (Purple)**:
- **2018**: ~3,000 jobs
- **2019**: ~4,000 jobs
- **2020**: ~5,000 jobs
- **2021**: ~7,000 jobs
- **2022**: ~10,000 jobs
- **2023**: ~15,000 jobs
- **Trend**: Exponential growth starting in 2021.
4. **VimPackages (Pink)**:
- **2018**: ~1,000 jobs
- **2019**: ~1,500 jobs
- **2020**: ~2,000 jobs
- **2021**: ~2,500 jobs
- **2022**: ~3,000 jobs
- **2023**: ~3,500 jobs
- **Trend**: Consistent but slower growth.
5. **EmacsPackages (Cyan)**:
- **2018**: ~2,000 jobs
- **2019**: ~2,500 jobs
- **2020**: ~3,000 jobs
- **2021**: ~3,500 jobs
- **2022**: ~4,000 jobs
- **2023**: ~4,500 jobs
- **Trend**: Gradual linear increase.
6. **Xorg (Orange)**:
- **2018**: ~1,000 jobs
- **2019**: ~1,200 jobs
- **2020**: ~1,500 jobs
- **2021**: ~1,800 jobs
- **2022**: ~2,000 jobs
- **2023**: ~2,500 jobs
- **Trend**: Steady but minimal growth.
7. **Lisp (Light Green)**:
- **2018**: ~800 jobs
- **2019**: ~1,000 jobs
- **2020**: ~1,200 jobs
- **2021**: ~1,500 jobs
- **2022**: ~2,000 jobs
- **2023**: ~3,000 jobs
- **Trend**: Accelerated growth post-2021.
8. **Other Ecosystems (Blue)**:
- **2018**: ~1,000 jobs
- **2019**: ~1,500 jobs
- **2020**: ~2,000 jobs
- **2021**: ~2,500 jobs
- **2022**: ~3,000 jobs
- **2023**: ~4,000 jobs
- **Trend**: Linear growth with a slight dip in 2023.
### Key Observations
- **Dominance of Base Ecosystem**: The red segment (base) consistently represents the largest portion of jobs, growing from ~7,000 in 2018 to ~20,000 in 2023.
- **Python and Haskell Surge**: Both ecosystems show exponential growth post-2021, with Python overtaking Haskell in 2023 (~15,000 vs. ~14,000 jobs).
- **2023 Spike**: A sharp increase in total jobs (~45,000) in 2023, driven by Python, Haskell, and Lisp.
- **Stability of Legacy Ecosystems**: VimPackages, EmacsPackages, and Xorg show minimal growth, remaining below 5,000 jobs each.
### Interpretation
The data suggests a shift toward modern ecosystems like Python and Haskell, which have gained significant traction in recent years. The base ecosystem’s steady growth indicates its foundational role, while the 2023 spike may reflect industry-wide adoption of emerging technologies. Legacy ecosystems (VimPackages, EmacsPackages, Xorg) remain niche, highlighting their limited scalability. The dip in "Other ecosystems" in 2023 could signal consolidation or reduced diversity in smaller niches. Overall, the chart underscores the dynamic evolution of tech job markets, with Python and Haskell emerging as dominant forces.