\n
## Bar Chart: Time vs Core Count
### Overview
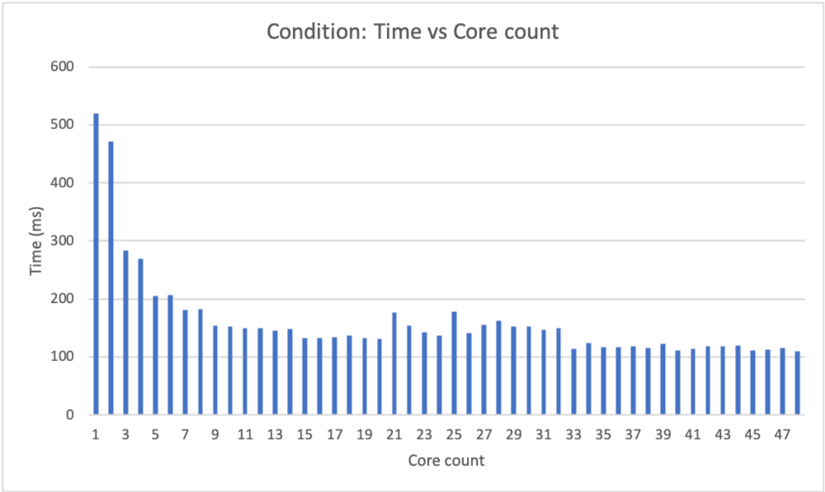
The image presents a bar chart illustrating the relationship between "Core Count" and "Time (ms)". The chart displays the time taken for a process to complete as the number of cores used increases. The chart is titled "Condition: Time vs Core count".
### Components/Axes
* **Title:** Condition: Time vs Core count (centered at the top)
* **X-axis:** Core Count, ranging from 1 to 47, with increments of 2.
* **Y-axis:** Time (ms), ranging from 0 to 600, with increments of 100.
* **Data Series:** A single series of blue bars representing the time taken for each core count.
### Detailed Analysis
The chart shows a steep decrease in time taken as the core count increases from 1 to approximately 7. After this point, the decrease in time becomes much less pronounced, and the time levels off, fluctuating around 100-150ms.
Here's a breakdown of approximate values, reading from left to right:
* Core Count 1: ~480 ms
* Core Count 3: ~270 ms
* Core Count 5: ~200 ms
* Core Count 7: ~170 ms
* Core Count 9: ~150 ms
* Core Count 11: ~140 ms
* Core Count 13: ~130 ms
* Core Count 15: ~130 ms
* Core Count 17: ~130 ms
* Core Count 19: ~140 ms
* Core Count 21: ~150 ms
* Core Count 23: ~140 ms
* Core Count 25: ~130 ms
* Core Count 27: ~140 ms
* Core Count 29: ~130 ms
* Core Count 31: ~120 ms
* Core Count 33: ~110 ms
* Core Count 35: ~110 ms
* Core Count 37: ~110 ms
* Core Count 39: ~110 ms
* Core Count 41: ~110 ms
* Core Count 43: ~110 ms
* Core Count 45: ~110 ms
* Core Count 47: ~110 ms
The bars are consistently blue.
### Key Observations
* The most significant performance gain is achieved when increasing the core count from 1 to 7.
* Beyond 7 cores, the performance improvement diminishes significantly.
* The time taken appears to stabilize around 110-150ms for core counts greater than 20.
* There is some minor fluctuation in the time taken for higher core counts, but no clear trend.
### Interpretation
The data suggests that there is a diminishing return to increasing the number of cores beyond a certain point (approximately 7 in this case). Initially, adding more cores significantly reduces the processing time, likely due to increased parallelism. However, as the core count increases, the overhead associated with coordinating the cores and distributing the workload begins to outweigh the benefits of additional processing power. This could be due to factors such as memory contention, communication overhead, or the inherent limitations of the algorithm being used. The stabilization of the time taken at higher core counts indicates that the process has reached a point where it is no longer significantly limited by the number of available cores. This data could be used to optimize resource allocation and determine the optimal number of cores for a given task. The chart demonstrates a classic example of Amdahl's Law in action, where the speedup of a program using multiple processors is limited by the sequential portion of the program.