## Bar Chart: Latency Comparison Across GPU Configurations and Matrix Sizes
### Overview
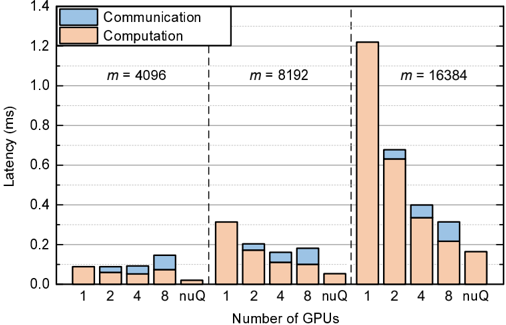
The chart compares communication and computation latency (in milliseconds) for three matrix sizes (m = 4096, 8192, 16384) across varying numbers of GPUs (1, 2, 4, 8) and a "nuQ" configuration. Latency is split into two components: communication (blue) and computation (orange). Vertical dashed lines separate the three matrix size categories.
### Components/Axes
- **X-axis**: Number of GPUs (1, 2, 4, 8, "nuQ"). Labels are centered below each bar group.
- **Y-axis**: Latency (ms), ranging from 0.0 to 1.4 ms in 0.2 ms increments.
- **Legend**: Top-left corner, with blue representing "Communication" and orange representing "Computation."
- **Matrix Size Labels**: "m = 4096" (left), "m = 8192" (middle), "m = 16384" (right), positioned above their respective sections.
### Detailed Analysis
#### Communication Latency (Blue)
- **m = 4096**:
- 1 GPU: ~0.05 ms
- 2 GPUs: ~0.06 ms
- 4 GPUs: ~0.08 ms
- 8 GPUs: ~0.12 ms
- **m = 8192**:
- 1 GPU: ~0.15 ms
- 2 GPUs: ~0.18 ms
- 4 GPUs: ~0.20 ms
- 8 GPUs: ~0.25 ms
- **m = 16384**:
- 1 GPU: ~0.30 ms
- 2 GPUs: ~0.35 ms
- 4 GPUs: ~0.40 ms
- 8 GPUs: ~0.45 ms
- **nuQ**: No communication latency (no blue bars).
#### Computation Latency (Orange)
- **m = 4096**:
- 1 GPU: ~0.03 ms
- 2 GPUs: ~0.04 ms
- 4 GPUs: ~0.07 ms
- 8 GPUs: ~0.08 ms
- nuQ: ~0.02 ms
- **m = 8192**:
- 1 GPU: ~0.10 ms
- 2 GPUs: ~0.12 ms
- 4 GPUs: ~0.15 ms
- 8 GPUs: ~0.20 ms
- nuQ: ~0.05 ms
- **m = 16384**:
- 1 GPU: ~0.60 ms
- 2 GPUs: ~0.65 ms
- 4 GPUs: ~0.70 ms
- 8 GPUs: ~0.75 ms
- nuQ: ~0.15 ms
### Key Observations
1. **Computation Dominates**: Computation latency consistently exceeds communication latency across all matrix sizes and GPU counts.
2. **Scaling Trends**:
- For smaller matrices (m = 4096), latency increases modestly with more GPUs.
- For larger matrices (m = 16384), latency spikes dramatically, especially for computation.
3. **nuQ Exception**: The "nuQ" configuration shows significantly lower computation latency (e.g., ~0.15 ms for m = 16384 vs. ~0.75 ms for 8 GPUs).
4. **Communication Scaling**: Communication latency increases with matrix size but remains relatively stable per GPU count (e.g., ~0.45 ms for 8 GPUs in m = 16384 vs. ~0.12 ms for 8 GPUs in m = 4096).
### Interpretation
- **Computation Bottleneck**: The data highlights computation as the primary latency driver, particularly for large matrices. Adding GPUs reduces per-GPU computation time but does not eliminate the inherent complexity of larger matrices.
- **nuQ Optimization**: The "nuQ" configuration suggests a specialized setup (e.g., no inter-GPU communication overhead) that drastically reduces computation latency, likely by avoiding synchronization delays.
- **Scalability Limits**: While increasing GPUs improves performance, diminishing returns are evident for large matrices (e.g., 8 GPUs for m = 16384 only reduces computation latency to ~0.75 ms from ~0.60 ms for 1 GPU).
- **Communication-Computation Balance**: For smaller matrices, communication latency is a smaller fraction of total latency, but this ratio worsens for larger matrices (e.g., m = 16384: communication = 0.45 ms, computation = 0.75 ms → 60% of total latency).
### Spatial Grounding & Verification
- **Legend Alignment**: Blue bars (communication) and orange bars (computation) match the legend colors exactly.
- **Trend Verification**:
- Communication latency slopes upward with matrix size but plateaus per GPU count.
- Computation latency slopes upward steeply for larger matrices, confirming its dominance.
- **Outliers**: The "nuQ" configuration deviates from the GPU-count trend, suggesting a non-standard optimization.
### Conclusion
The chart demonstrates that computation latency scales non-linearly with matrix size, while communication latency grows linearly. The "nuQ" configuration offers a potential pathway to mitigate computation bottlenecks, though its applicability depends on the specific hardware/software constraints.