TECHNICAL ASSET FINGERPRINT
904e244ddcb2217a4cca5c4f
Click to view fullscreen
Press ESC or click to close
FOUND IN PAPERS
EXPERT: gemini-2.5-flash-free VERSION 1
RUNTIME: google-free/gemini-2.5-flash
INTEL_VERIFIED
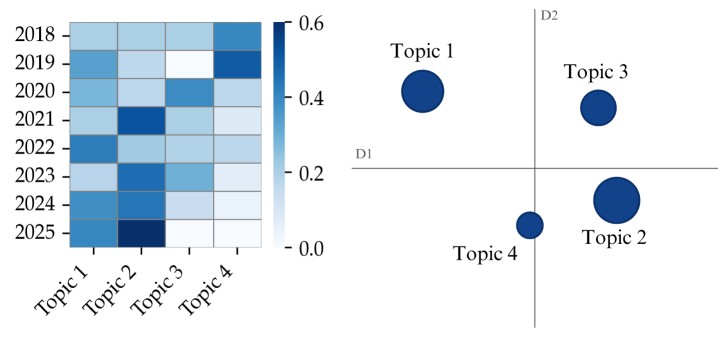
## Combined Chart: Topic Evolution and Spatial Distribution
### Overview
The image presents two distinct but related visualizations side-by-side. On the left is a heatmap illustrating the temporal evolution or prevalence of four different topics (Topic 1 to Topic 4) across eight years (2018 to 2025). On the right is a 2D scatter plot, or bubble chart, showing the spatial distribution and relative importance (indicated by size) of these same four topics within a dimensional space defined by D1 and D2.
### Components/Axes
**Left Chart: Heatmap (Topic Prevalence Over Time)**
* **Type:** Heatmap
* **Y-axis (Vertical):** Labeled with years, from bottom to top: 2018, 2019, 2020, 2021, 2022, 2023, 2024, 2025.
* **X-axis (Horizontal):** Labeled with topics, from left to right, rotated for readability: Topic 1, Topic 2, Topic 3, Topic 4.
* **Color Bar Legend (Right side of heatmap):** A vertical color gradient bar indicating the value associated with each shade of blue.
* 0.6 (darkest blue)
* 0.4 (medium-dark blue)
* 0.2 (medium-light blue)
* 0.0 (lightest blue/white)
* The gradient transitions smoothly from white/very light blue at 0.0 to a deep, dark blue at 0.6.
**Right Chart: Bubble Chart (Topic Spatial Distribution)**
* **Type:** Bubble Chart / Scatter Plot
* **Horizontal Axis (X-axis):** Labeled "D1". This axis spans from negative values on the left to positive values on the right, with the origin (0) at the center.
* **Vertical Axis (Y-axis):** Labeled "D2". This axis spans from negative values at the bottom to positive values at the top, with the origin (0) at the center.
* **Data Points:** Four dark blue circular bubbles, each labeled with a topic name (Topic 1, Topic 2, Topic 3, Topic 4). The size of the bubbles varies.
### Detailed Analysis
**Heatmap Data (Approximate values based on color intensity):**
| Year | Topic 1 (Value) | Topic 2 (Value) | Topic 3 (Value) | Topic 4 (Value) |
| :--- | :-------------- | :-------------- | :-------------- | :-------------- |
| 2018 | ~0.10 (Light) | ~0.10 (Light) | ~0.10 (Light) | ~0.55 (Dark) |
| 2019 | ~0.10 (Light) | ~0.10 (Light) | ~0.10 (Light) | ~0.55 (Dark) |
| 2020 | ~0.10 (Light) | ~0.10 (Light) | ~0.25 (Medium) | ~0.10 (Light) |
| 2021 | ~0.10 (Light) | ~0.50 (Dark) | ~0.10 (Light) | ~0.10 (Light) |
| 2022 | ~0.25 (Medium) | ~0.10 (Light) | ~0.10 (Light) | ~0.10 (Light) |
| 2023 | ~0.25 (Medium) | ~0.25 (Medium) | ~0.25 (Medium) | ~0.10 (Light) |
| 2024 | ~0.35 (Med-Dark)| ~0.50 (Dark) | ~0.10 (Light) | ~0.10 (Light) |
| 2025 | ~0.50 (Dark) | ~0.50 (Dark) | ~0.10 (Light) | ~0.10 (Light) |
**Heatmap Trends:**
* **Topic 1:** Shows a clear upward trend. It remains low (~0.10) from 2018-2021, then increases to medium (~0.25) in 2022-2023, and becomes significantly high (~0.35 to ~0.50) in 2024-2025.
* **Topic 2:** Exhibits a fluctuating pattern with distinct peaks. It is low (~0.10) for 2018-2020, then spikes to high (~0.50) in 2021, drops back to low (~0.10) in 2022, rises to medium (~0.25) in 2023, and reaches high levels again (~0.50) in 2024-2025.
* **Topic 3:** Generally maintains a low prevalence (~0.10) throughout the period, with slight increases to medium (~0.25) in 2020 and 2023.
* **Topic 4:** Shows a strong downward trend. It is very high (~0.55) in 2018-2019, then drops sharply to low levels (~0.10) from 2020 onwards and remains low.
**Bubble Chart Data (Approximate coordinates and relative sizes):**
* **Topic 1:**
* Position: Top-left quadrant.
* Coordinates (D1, D2): (~-0.7, ~0.6)
* Size: Medium-large.
* **Topic 2:**
* Position: Bottom-right quadrant.
* Coordinates (D1, D2): (~0.7, ~-0.4)
* Size: Largest.
* **Topic 3:**
* Position: Top-right quadrant.
* Coordinates (D1, D2): (~0.6, ~0.6)
* Size: Medium.
* **Topic 4:**
* Position: Bottom-left quadrant, closest to the origin.
* Coordinates (D1, D2): (~-0.3, ~-0.5)
* Size: Smallest.
### Key Observations
* **Temporal Dynamics:** Topics show diverse temporal patterns. Topic 4 is a declining topic, Topic 3 is consistently low, while Topic 1 is an emerging topic, and Topic 2 is a recurring/fluctuating topic with high recent prevalence.
* **Topic Importance (Bubble Size):** The bubble chart suggests Topic 2 is the most prominent overall, followed by Topic 1, then Topic 3, and Topic 4 is the least prominent. This generally aligns with their recent or overall prevalence in the heatmap.
* **Spatial Grouping:**
* Topics 1 and 3 are both in the positive D2 region (upper half), suggesting some shared characteristic along Dimension 2.
* Topics 2 and 4 are both in the negative D2 region (lower half), suggesting another shared characteristic along Dimension 2.
* Topics 1 and 4 are in the negative D1 region (left half).
* Topics 2 and 3 are in the positive D1 region (right half).
* **Opposing Topics:** Topic 1 and Topic 2 appear diagonally opposite, as do Topic 3 and Topic 4, suggesting contrasting characteristics across both D1 and D2 dimensions.
### Interpretation
The two charts provide a comprehensive view of topic dynamics and relationships. The heatmap reveals the "life cycle" of each topic over an eight-year span, while the bubble chart offers a static "snapshot" of their relative positions and importance in a conceptual space.
* **Topic 4** appears to be a "legacy" topic, highly prevalent in earlier years (2018-2019) but quickly fading into insignificance by 2020. Its small bubble size in the D1/D2 space reflects this diminished importance. Its position in the bottom-left quadrant (negative D1, negative D2) might indicate it represents an older, perhaps less innovative or less relevant theme compared to others.
* **Topic 3** maintains a consistently low profile throughout the years, with only minor fluctuations. Its medium-sized bubble, despite low prevalence, might suggest a foundational or niche topic that is always present but never dominant. Its position in the top-right quadrant (positive D1, positive D2) suggests it shares characteristics with Topic 1 along D2 but is distinct along D1.
* **Topic 2** is a highly dynamic topic, experiencing significant surges in prevalence (2021, 2024-2025). Its large bubble size indicates its overall high importance or impact. Its position in the bottom-right quadrant (positive D1, negative D2) suggests it is distinct from Topic 1 and 3, possibly representing a different domain or approach. Its recurring high prevalence suggests it's a persistent or cyclical theme.
* **Topic 1** is an "emerging" topic, showing a clear and strong upward trend in prevalence, especially in the later years (2022-2025). Its medium-large bubble size, while not the largest, suggests growing importance, potentially reflecting its future relevance. Its position in the top-left quadrant (negative D1, positive D2) places it in opposition to Topic 2, but sharing some D2 characteristics with Topic 3. This could imply it's a new direction or innovation.
The D1 and D2 dimensions likely represent underlying semantic or thematic characteristics that differentiate the topics. For instance, D1 could represent a spectrum from "traditional" (negative D1) to "innovative" (positive D1), while D2 could represent "technical" (positive D2) to "social" (negative D2).
* If D1 is "Traditional (-) to Innovative (+)", then Topics 1 and 4 are more traditional, while Topics 2 and 3 are more innovative.
* If D2 is "Technical (+) to Social (-)", then Topics 1 and 3 are more technical, while Topics 2 and 4 are more social.
This interpretation suggests a shift in focus over time, with Topic 4 (perhaps an older, traditional-social theme) declining, and Topic 1 (an emerging, traditional-technical theme) gaining prominence, while Topic 2 (an innovative-social theme) remains highly impactful. The interplay between these temporal trends and spatial relationships provides a rich understanding of the topic landscape.
DECODING INTELLIGENCE...