TECHNICAL ASSET FINGERPRINT
904e244ddcb2217a4cca5c4f
Click to view fullscreen
Press ESC or click to close
FOUND IN PAPERS
EXPERT: healer-alpha-free VERSION 1
RUNTIME: free/openrouter/healer-alpha
INTEL_VERIFIED
\n
## Heatmap and Scatter Plot: Topic Analysis (2018-2025)
### Overview
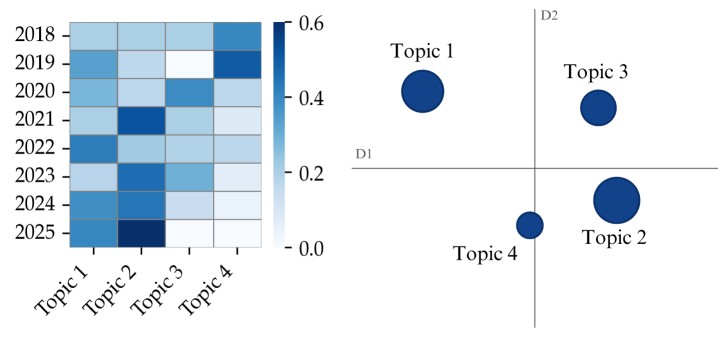
The image is a composite visualization containing two distinct charts side-by-side. On the left is a heatmap showing the intensity or prevalence of four topics across the years 2018 to 2025. On the right is a scatter plot (or bubble chart) positioning the same four topics within a two-dimensional space defined by axes D1 and D2, where the size of each bubble likely represents a third variable (e.g., overall importance, volume, or confidence).
### Components/Axes
**Left Chart (Heatmap):**
* **Y-axis (Vertical):** Years, listed from top to bottom: `2018`, `2019`, `2020`, `2021`, `2022`, `2023`, `2024`, `2025`.
* **X-axis (Horizontal):** Topics, listed from left to right: `Topic 1`, `Topic 2`, `Topic 3`, `Topic 4`.
* **Color Scale/Legend:** A vertical color bar positioned to the right of the heatmap. It maps color intensity to a numerical value.
* **Label:** None explicitly on the bar, but values are marked.
* **Scale:** Ranges from `0.0` (bottom, very light blue/white) to `0.6` (top, dark blue). Intermediate markers are at `0.2` and `0.4`.
* **Color Gradient:** A sequential blue palette, where darker blue indicates a higher value.
**Right Chart (Scatter/Bubble Plot):**
* **Axes:**
* **Horizontal Axis (D1):** A central vertical line labeled `D1` at the top. The axis itself is not numerically scaled.
* **Vertical Axis (D2):** A central horizontal line labeled `D2` at the top right. The axis itself is not numerically scaled.
* The two axes intersect at a central origin point, dividing the plot into four quadrants.
* **Data Points (Bubbles):** Four dark blue circles, each labeled with a topic name.
* **Topic 1:** Positioned in the top-left quadrant (negative D1, positive D2).
* **Topic 3:** Positioned in the top-right quadrant (positive D1, positive D2).
* **Topic 2:** Positioned in the bottom-right quadrant (positive D1, negative D2). This is the largest bubble.
* **Topic 4:** Positioned in the bottom-center, slightly left of the D2 axis (near-zero D1, negative D2). This is the smallest bubble.
### Detailed Analysis
**Heatmap Data (Approximate Values):**
The following table reconstructs the heatmap data. Values are estimated based on color intensity relative to the 0.0-0.6 scale. "VL" = Very Light (≈0.0-0.1), "L" = Light (≈0.1-0.3), "M" = Medium (≈0.3-0.5), "D" = Dark (≈0.5-0.6).
| Year | Topic 1 | Topic 2 | Topic 3 | Topic 4 |
| :--- | :--- | :--- | :--- | :--- |
| **2018** | L (≈0.2) | L (≈0.2) | L (≈0.2) | M (≈0.4) |
| **2019** | M (≈0.4) | L (≈0.2) | VL (≈0.05) | D (≈0.55) |
| **2020** | L (≈0.2) | L (≈0.2) | M (≈0.4) | L (≈0.2) |
| **2021** | L (≈0.2) | D (≈0.5) | L (≈0.2) | VL (≈0.1) |
| **2022** | D (≈0.5) | L (≈0.2) | L (≈0.2) | L (≈0.2) |
| **2023** | L (≈0.2) | M (≈0.4) | M (≈0.4) | L (≈0.2) |
| **2024** | M (≈0.4) | M (≈0.4) | L (≈0.2) | VL (≈0.1) |
| **2025** | M (≈0.4) | D (≈0.6) | VL (≈0.05) | VL (≈0.05) |
**Scatter Plot Spatial Layout & Bubble Size:**
* **Topic 1:** Located far left on D1, moderately high on D2. Medium-large bubble size.
* **Topic 3:** Located far right on D1, moderately high on D2. Medium-large bubble size (similar to Topic 1).
* **Topic 2:** Located far right on D1, low on D2. **Largest bubble** by a significant margin.
* **Topic 4:** Located near the center on D1, low on D2. **Smallest bubble**.
### Key Observations
1. **Heatmap Trends:**
* **Topic 2** shows a clear **upward trend**, culminating in its highest value (≈0.6) in 2025.
* **Topic 4** shows a **downward trend**, starting relatively high in 2018-2019 and fading to very low values (≈0.05-0.1) from 2021 onward.
* **Topic 1** and **Topic 3** exhibit **volatile, non-linear patterns** without a single clear trend. Topic 1 peaks in 2022, while Topic 3 peaks in 2020 and 2023.
* The year **2025** shows the most extreme divergence: Topic 2 is at its maximum, while Topics 3 and 4 are at their minima.
2. **Scatter Plot Relationships:**
* **D1 Axis Separation:** Topics 1 and 4 are on the left/center (negative/neutral D1), while Topics 2 and 3 are on the right (positive D1). This suggests D1 may represent a primary differentiating factor between two groups of topics.
* **D2 Axis Separation:** Topics 1 and 3 are high on D2 (positive), while Topics 2 and 4 are low on D2 (negative). This suggests D2 represents a second, independent differentiating factor.
* **Bubble Size Anomaly:** Topic 2's large size is notable. Given its rising trend in the heatmap, the size likely reinforces its growing dominance or importance in the dataset.
### Interpretation
This visualization likely analyzes the evolution and relationship of four thematic topics over an eight-year period. The **heatmap** provides a temporal view, showing how the prominence of each topic has waxed and waned. The **scatter plot** provides a spatial or conceptual view, mapping the topics onto two latent dimensions (D1 and D2) that define their core characteristics or contexts.
* **What the data suggests:** The data indicates a significant shift in focus. **Topic 2** has become the dominant theme by 2025, both in terms of its heatmap intensity and its large bubble size, and it is strongly associated with positive D1 and negative D2 values. Conversely, **Topic 4** has become marginal. **Topic 1** and **Topic 3** remain relevant but in a more fluctuating manner, occupying distinct conceptual spaces (Topic 1: negative D1/positive D2; Topic 3: positive D1/positive D2).
* **How elements relate:** The two charts are complementary. A topic's position in the scatter plot (its "conceptual signature") may explain its temporal behavior. For example, Topic 2's unique position (high D1, low D2) might correlate with a real-world factor that gained traction over time, driving its heatmap values up. Topic 4's central, low-D2 position might indicate a generic or foundational theme that was later superseded by more specific topics.
* **Notable anomalies:** The most striking anomaly is the **divergent fate of Topic 2 and Topic 4**. They start with comparable heatmap values in 2018 but end at opposite extremes in 2025. Their positions on the scatter plot are also opposites along the D1 axis. This suggests they may represent opposing concepts or competing narratives within the analyzed domain. The lack of numerical scales on the scatter plot axes (D1, D2) is a limitation, preventing precise quantitative interpretation of the spatial relationships.
DECODING INTELLIGENCE...