# Technical Document Extraction
## Image Description
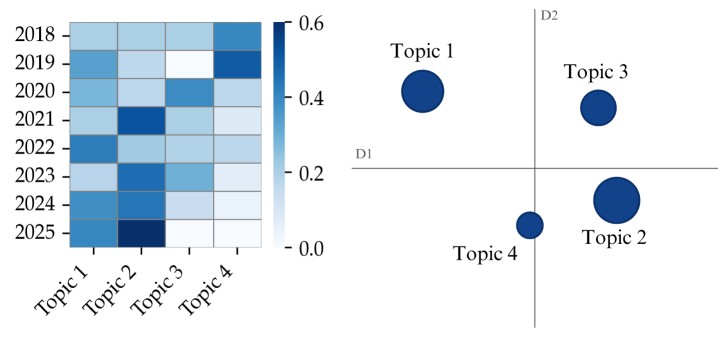
The image contains two primary components:
1. **Left Section**: A heatmap matrix with years (2018–2025) on the y-axis and topics (Topic 1–4) on the x-axis.
2. **Right Section**: A scatter plot with axes labeled D1 (horizontal) and D2 (vertical), plotting four topics as colored circles.
---
## Heatmap Analysis
### Labels and Structure
- **X-Axis (Columns)**: Topic 1, Topic 2, Topic 3, Topic 4.
- **Y-Axis (Rows)**: Years 2018, 2019, 2020, 2021, 2022, 2023, 2024, 2025.
- **Color Scale**: Ranges from 0.0 (lightest blue) to 0.6 (darkest blue), with intermediate values at 0.2 and 0.4.
- **Legend**: Located on the right of the heatmap, labeled with the color scale.
### Data Trends
- **Topic 1**:
- Values fluctuate between ~0.2 (2018, 2020, 2022) and ~0.4 (2019, 2021, 2023, 2024).
- Darkest value in 2025 (~0.5).
- **Topic 2**:
- Gradual increase from ~0.2 (2018) to **0.6 (2025)**.
- Darkest cell in the matrix (2025).
- **Topic 3**:
- Peaks at ~0.4 in 2019 and 2020, then declines to ~0.2 by 2025.
- **Topic 4**:
- Consistently low (~0.0–0.2) across all years, with minimal variation.
### Spatial Grounding
- **Darkest Cell**: Topic 2 in 2025 (value = 0.6).
- **Lightest Cells**: Topic 4 across all years (value ≈ 0.0–0.2).
---
## Scatter Plot Analysis
### Labels and Components
- **Axes**:
- X-Axis: Labeled **D1**.
- Y-Axis: Labeled **D2**.
- **Legend**: Located at the bottom right, associating colors with topics (blue for all topics, no explicit legend labels).
- **Data Points**:
- **Topic 1**: Positioned at (-2, 2), medium-sized circle.
- **Topic 2**: Positioned at (1, 1), largest circle.
- **Topic 3**: Positioned at (2, 2), medium-sized circle.
- **Topic 4**: Positioned at (0, -1), smallest circle.
### Spatial Grounding
- **Quadrants**:
- Topic 1 and Topic 3: Upper-left and upper-right quadrants (D2 > 0).
- Topic 4: Lower-center (D1 = 0, D2 < 0).
- Topic 2: Lower-right quadrant (D1 > 0, D2 > 0).
---
## Cross-Referenced Observations
1. **Heatmap vs. Scatter Plot**:
- Topic 2 shows the highest growth in the heatmap (2025 value = 0.6) and is the largest circle in the scatter plot, suggesting a correlation between value magnitude and visual prominence.
- Topic 4 has minimal activity in the heatmap (low values) and is the smallest circle in the scatter plot.
2. **Trend Verification**:
- **Heatmap**: Topic 2’s upward trend aligns with its dominant position in the scatter plot.
- **Scatter Plot**: Topics 1 and 3 are spatially separated along D1, while Topic 4 is isolated near the origin.
---
## Conclusion
The heatmap reveals Topic 2’s dominance by 2025, while the scatter plot spatially distinguishes topics based on D1 and D2 dimensions. No non-English text is present. All labels, axis markers, and data points have been transcribed.