## Bar Chart: MetaQA Hit@1 Scores (Mean ± Std) for Our Method and Baselines
### Overview
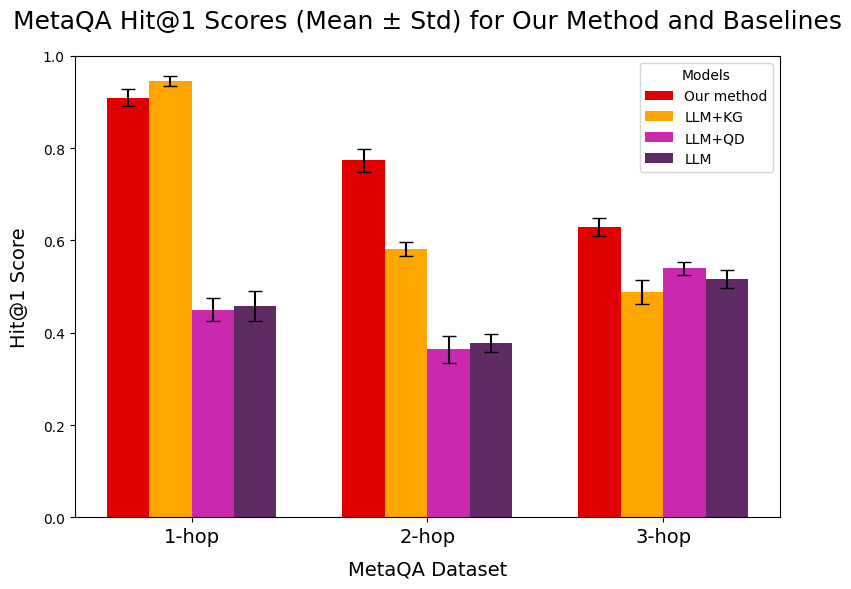
The image is a bar chart comparing the Hit@1 scores of different models on the MetaQA dataset. The x-axis represents the number of hops (1-hop, 2-hop, 3-hop), and the y-axis represents the Hit@1 score. The chart compares "Our method" with three baseline models: LLM+KG, LLM+QD, and LLM. Error bars indicate the standard deviation.
### Components/Axes
* **Title:** MetaQA Hit@1 Scores (Mean ± Std) for Our Method and Baselines
* **X-axis:** MetaQA Dataset, with categories 1-hop, 2-hop, and 3-hop.
* **Y-axis:** Hit@1 Score, ranging from 0.0 to 1.0 in increments of 0.2.
* **Legend (Top-Right):**
* Red: Our method
* Orange: LLM+KG
* Magenta: LLM+QD
* Purple: LLM
### Detailed Analysis
**1-hop:**
* **Our method (Red):** Hit@1 score is approximately 0.92, with a small standard deviation.
* **LLM+KG (Orange):** Hit@1 score is approximately 0.95, with a small standard deviation.
* **LLM+QD (Magenta):** Hit@1 score is approximately 0.45, with a small standard deviation.
* **LLM (Purple):** Hit@1 score is approximately 0.46, with a small standard deviation.
**2-hop:**
* **Our method (Red):** Hit@1 score is approximately 0.78, with a small standard deviation.
* **LLM+KG (Orange):** Hit@1 score is approximately 0.58, with a small standard deviation.
* **LLM+QD (Magenta):** Hit@1 score is approximately 0.37, with a small standard deviation.
* **LLM (Purple):** Hit@1 score is approximately 0.38, with a small standard deviation.
**3-hop:**
* **Our method (Red):** Hit@1 score is approximately 0.63, with a small standard deviation.
* **LLM+KG (Orange):** Hit@1 score is approximately 0.50, with a small standard deviation.
* **LLM+QD (Magenta):** Hit@1 score is approximately 0.54, with a small standard deviation.
* **LLM (Purple):** Hit@1 score is approximately 0.52, with a small standard deviation.
### Key Observations
* "Our method" consistently outperforms the baseline models (LLM+QD and LLM) across all hop counts.
* LLM+KG performs comparably to "Our method" for 1-hop questions, but its performance decreases more rapidly as the number of hops increases.
* The performance of all models generally decreases as the number of hops increases, indicating that answering multi-hop questions is more challenging.
* The standard deviations are relatively small, suggesting that the results are consistent.
### Interpretation
The chart demonstrates that "Our method" is effective in answering questions from the MetaQA dataset, particularly for multi-hop questions. The addition of Knowledge Graph information (LLM+KG) improves performance for simple questions (1-hop), but its effectiveness diminishes for more complex questions. The LLM+QD and LLM baselines perform significantly worse, indicating the importance of the techniques used in "Our method" for reasoning and knowledge integration. The decreasing performance with increasing hops highlights the challenge of multi-hop reasoning in question answering.