## Bar Chart: MetaQA Hit@1 Scores (Mean ± Std) for Our Method and Baselines
### Overview
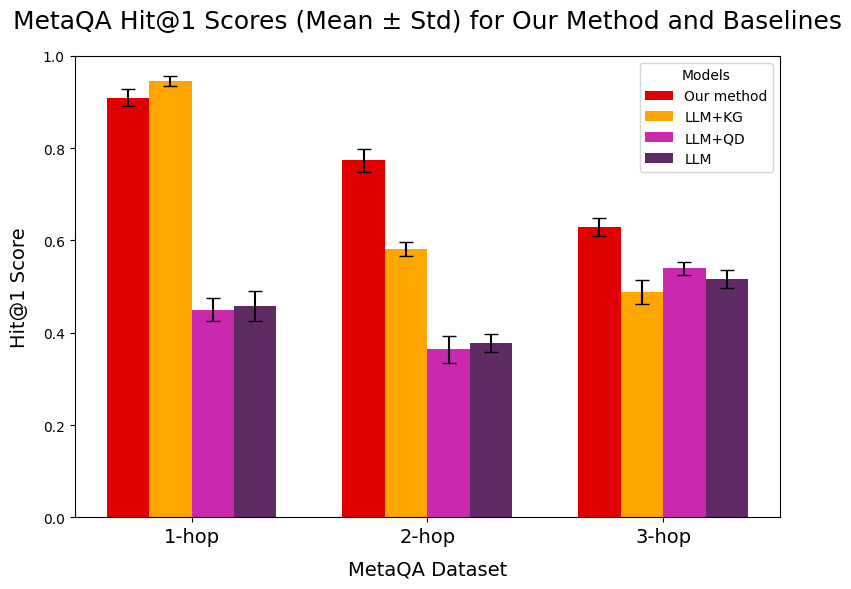
This is a grouped bar chart comparing the performance of four different models on the MetaQA dataset across three levels of question complexity (1-hop, 2-hop, 3-hop). The performance metric is the Hit@1 Score, presented as the mean with standard deviation error bars. The chart demonstrates how model performance degrades as the reasoning complexity (number of hops) increases.
### Components/Axes
* **Chart Title:** "MetaQA Hit@1 Scores (Mean ± Std) for Our Method and Baselines"
* **Y-Axis:**
* **Label:** "Hit@1 Score"
* **Scale:** Linear, ranging from 0.0 to 1.0, with major tick marks at 0.0, 0.2, 0.4, 0.6, 0.8, and 1.0.
* **X-Axis:**
* **Label:** "MetaQA Dataset"
* **Categories (from left to right):** "1-hop", "2-hop", "3-hop". These represent the complexity of the question-answer task.
* **Legend:**
* **Title:** "Models"
* **Position:** Top-right corner of the plot area.
* **Items (with associated colors):**
1. **Our method** (Red bar)
2. **LLM+KG** (Orange bar)
3. **LLM+QD** (Magenta/Pink bar)
4. **LLM** (Dark Purple bar)
* **Data Representation:** For each X-axis category (hop level), there is a group of four bars, one for each model in the legend order. Each bar has a black error bar extending vertically from its top, representing the standard deviation (Std).
### Detailed Analysis
**1-hop Category (Leftmost Group):**
* **Our method (Red):** Highest score. Bar height is approximately **0.91**. Error bar extends from ~0.89 to ~0.93.
* **LLM+KG (Orange):** Second highest. Bar height is approximately **0.95**. Error bar extends from ~0.93 to ~0.97.
* **LLM+QD (Magenta):** Significantly lower. Bar height is approximately **0.45**. Error bar extends from ~0.42 to ~0.48.
* **LLM (Purple):** Similar to LLM+QD. Bar height is approximately **0.46**. Error bar extends from ~0.43 to ~0.49.
**2-hop Category (Middle Group):**
* **Our method (Red):** Remains the highest. Bar height is approximately **0.78**. Error bar extends from ~0.76 to ~0.80.
* **LLM+KG (Orange):** Second highest, but with a larger drop from 1-hop. Bar height is approximately **0.58**. Error bar extends from ~0.56 to ~0.60.
* **LLM+QD (Magenta):** Lowest in this group. Bar height is approximately **0.37**. Error bar extends from ~0.34 to ~0.40.
* **LLM (Purple):** Slightly higher than LLM+QD. Bar height is approximately **0.38**. Error bar extends from ~0.35 to ~0.41.
**3-hop Category (Rightmost Group):**
* **Our method (Red):** Still the highest, but with a further decline. Bar height is approximately **0.63**. Error bar extends from ~0.61 to ~0.65.
* **LLM+KG (Orange):** Second highest. Bar height is approximately **0.49**. Error bar extends from ~0.47 to ~0.51.
* **LLM+QD (Magenta):** Third highest. Bar height is approximately **0.54**. Error bar extends from ~0.52 to ~0.56.
* **LLM (Purple):** Lowest in this group. Bar height is approximately **0.52**. Error bar extends from ~0.50 to ~0.54.
**Trend Verification per Model:**
* **Our method (Red):** Shows a clear, consistent downward trend as hop count increases (0.91 -> 0.78 -> 0.63). It is the top-performing model in all categories.
* **LLM+KG (Orange):** Also shows a consistent downward trend (0.95 -> 0.58 -> 0.49). It is the second-best model in all categories.
* **LLM+QD (Magenta):** Performance dips at 2-hop (0.45 -> 0.37) but recovers slightly at 3-hop (0.54). It is not consistently the worst or second-worst.
* **LLM (Purple):** Performance dips at 2-hop (0.46 -> 0.38) and recovers slightly at 3-hop (0.52). It is generally the lowest or tied for lowest performer.
### Key Observations
1. **Performance Hierarchy:** A clear performance hierarchy is established across all complexity levels: **Our method > LLM+KG > (LLM+QD ≈ LLM)**. The gap between the top two models and the bottom two is substantial, especially at 1-hop and 2-hop.
2. **Impact of Complexity:** All models experience a decline in Hit@1 Score as the number of reasoning hops increases from 1 to 3. This indicates that multi-hop reasoning is a more challenging task for all evaluated systems.
3. **Error Bar Overlap:** The error bars for "Our method" and "LLM+KG" do not overlap with each other or with the other two models in the 1-hop and 2-hop categories, suggesting the performance differences are statistically significant. At 3-hop, the error bars for LLM+QD and LLM overlap, indicating their performance is not significantly different at this complexity level.
4. **Relative Resilience:** While all models decline, "Our method" shows the most resilience in absolute terms, maintaining a score above 0.6 even at 3-hop complexity. LLM+KG experiences the sharpest drop between 1-hop and 2-hop.
### Interpretation
The data strongly suggests that the proposed model ("Our method") is the most effective for the MetaQA task, consistently outperforming the baselines regardless of question complexity. The inclusion of a Knowledge Graph (LLM+KG) provides a significant boost over the base LLM, particularly for simpler (1-hop) questions, but its advantage diminishes with increased complexity. The LLM+QD and base LLM models perform poorly in comparison, struggling even with 1-hop questions.
The universal downward trend across all models underscores the inherent difficulty of scaling question-answering systems to handle longer reasoning chains. The fact that "Our method" degrades more gracefully suggests its architecture or training better captures the dependencies required for multi-hop inference. The chart serves as evidence that the authors' method advances the state-of-the-art for this specific benchmark, addressing a key challenge in knowledge-intensive QA systems.