## Bar Chart: MetaQA Hit@1 Scores (Mean ± Std) for Our Method and Baselines
### Overview
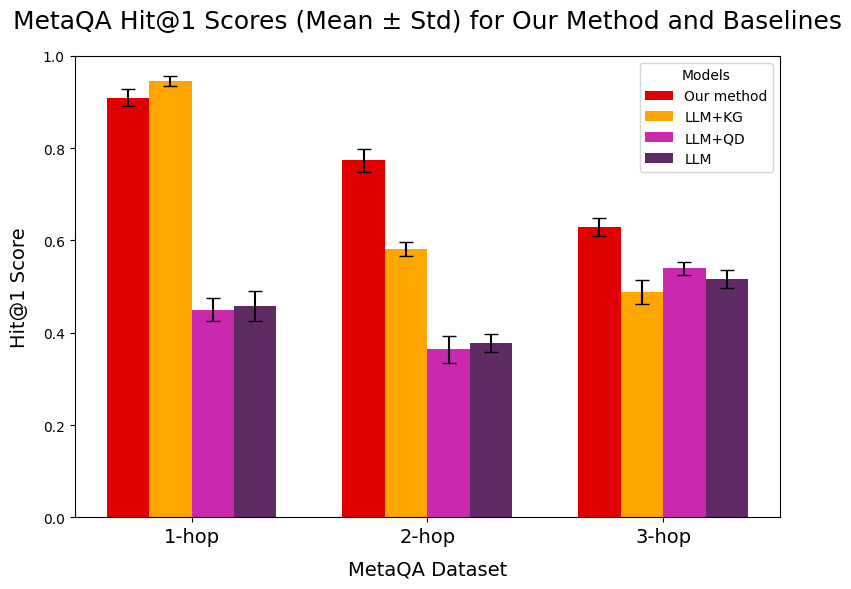
The chart compares the Hit@1 scores (mean ± standard deviation) of four models ("Our method," "LLM+KG," "LLM+QD," "LLM") across three MetaQA datasets: "1-hop," "2-hop," and "3-hop." The y-axis represents the Hit@1 score (0–1), while the x-axis categorizes the datasets. Error bars indicate variability (standard deviation).
### Components/Axes
- **X-axis (MetaQA Dataset)**: Labeled "1-hop," "2-hop," "3-hop" (left to right).
- **Y-axis (Hit@1 Score)**: Ranges from 0.0 to 1.0 in increments of 0.2.
- **Legend**: Located in the top-right corner, with four color-coded models:
- Red: "Our method"
- Orange: "LLM+KG"
- Purple: "LLM+QD"
- Dark purple: "LLM"
- **Error Bars**: Vertical lines on top of each bar, representing ± standard deviation.
### Detailed Analysis
#### 1-hop Dataset
- **Our method**: ~0.92 (±0.03)
- **LLM+KG**: ~0.95 (±0.02)
- **LLM+QD**: ~0.45 (±0.03)
- **LLM**: ~0.45 (±0.03)
#### 2-hop Dataset
- **Our method**: ~0.78 (±0.04)
- **LLM+KG**: ~0.59 (±0.03)
- **LLM+QD**: ~0.37 (±0.03)
- **LLM**: ~0.38 (±0.03)
#### 3-hop Dataset
- **Our method**: ~0.63 (±0.04)
- **LLM+KG**: ~0.49 (±0.03)
- **LLM+QD**: ~0.54 (±0.03)
- **LLM**: ~0.52 (±0.03)
### Key Observations
1. **"Our method" consistently outperforms all baselines** across all datasets, with the largest margin in the 1-hop dataset (~0.92 vs. 0.95 for "LLM+KG").
2. **"LLM+KG" shows a significant drop in performance** from 1-hop to 2-hop (0.95 → 0.59) and further to 3-hop (0.49).
3. **"LLM+QD" and "LLM" exhibit similar performance** in 2-hop and 3-hop, but "LLM+QD" slightly outperforms "LLM" in 3-hop (0.54 vs. 0.52).
4. **Error bars indicate variability**: "Our method" has the smallest error bars (≤0.04), suggesting higher reliability.
### Interpretation
The data demonstrates that **"Our method" is the most effective** for MetaQA tasks, particularly in 1-hop scenarios. The decline in performance for "LLM+KG" across datasets suggests it struggles with increasing complexity (hop count). "LLM+QD" and "LLM" perform comparably but lag behind "Our method," indicating potential limitations in their design or training. The error bars highlight that "Our method" has the most consistent results, making it a robust choice for MetaQA.