# Technical Document Extraction: Control Value Over Time
## Chart Title
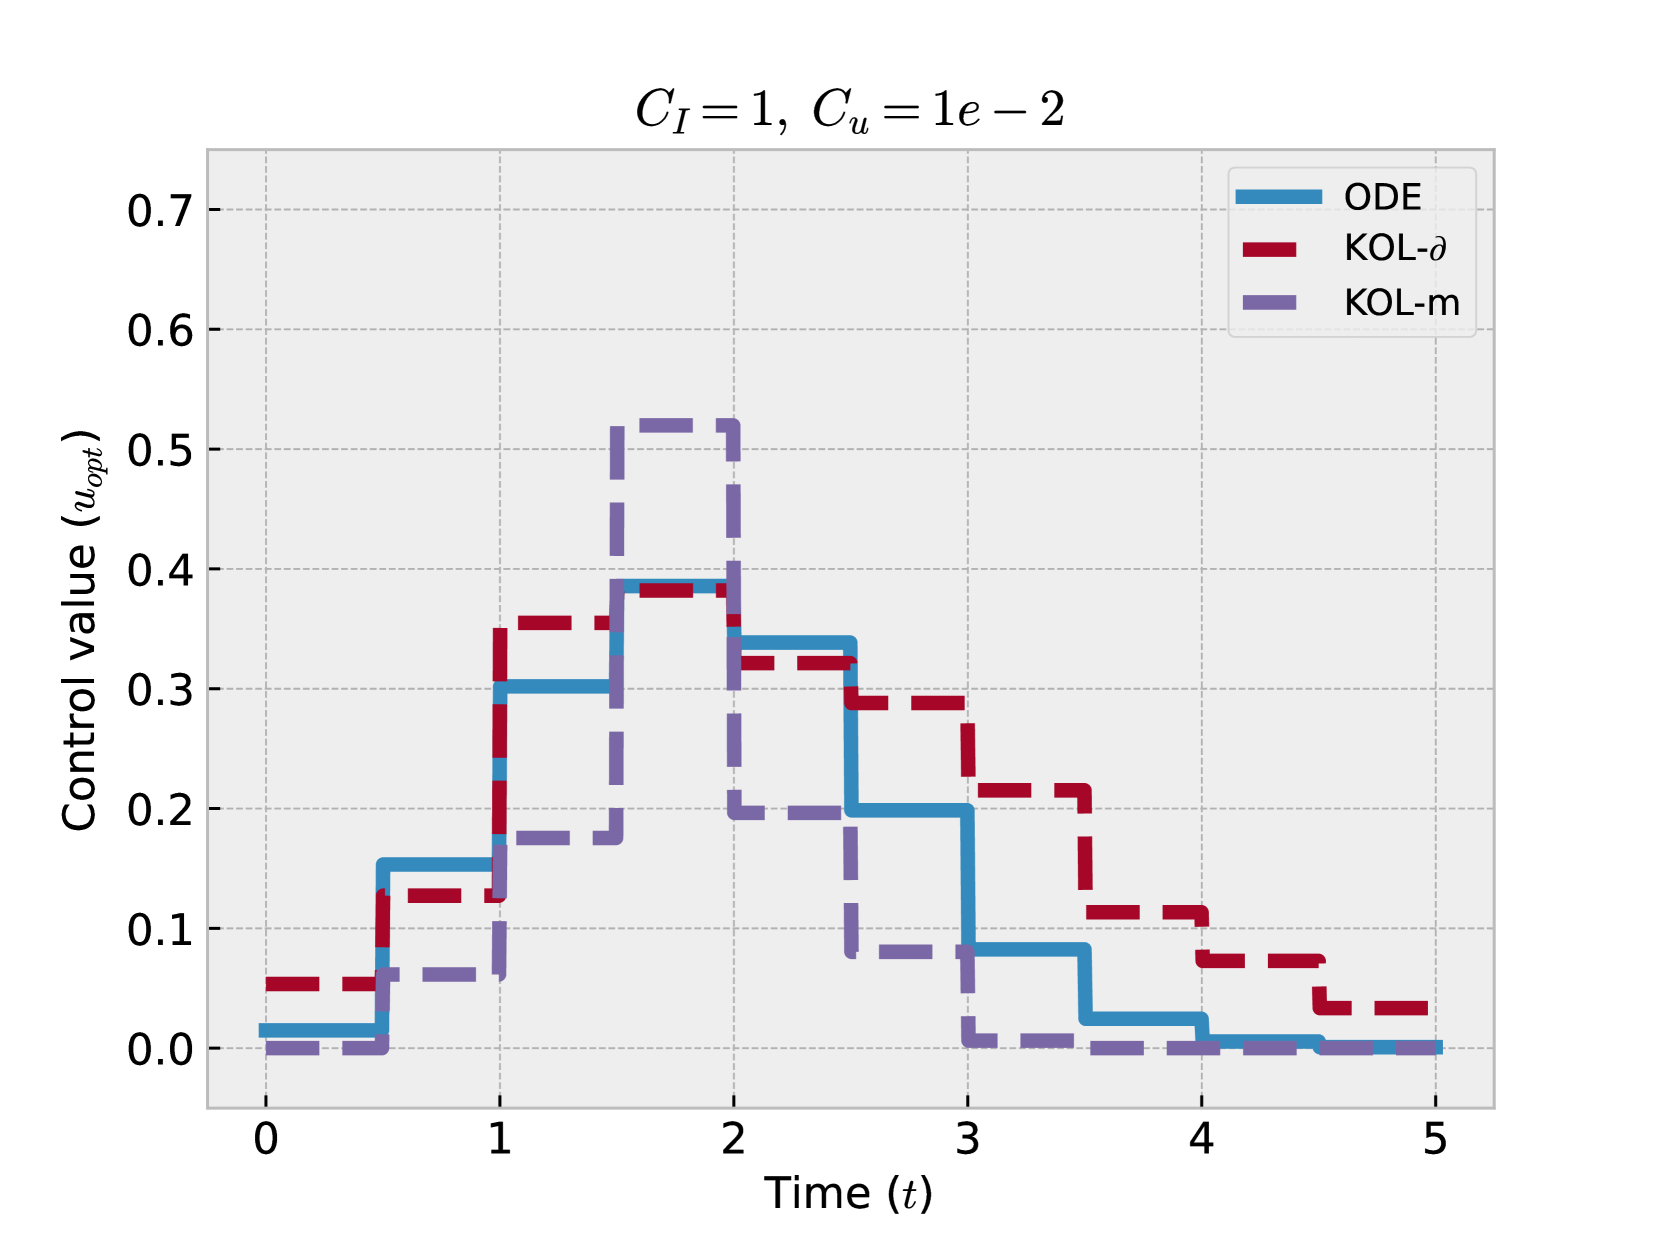
- **Title**: Control Value Over Time
- **Parameters**:
- \( C_I = 1 \)
- \( C_u = 1e-2 \)
## Axes
- **X-axis (Time, \( t \))**:
- Range: \( 0 \leq t \leq 5 \)
- Increment: 1
- **Y-axis (Control Value, \( u_{opt} \))**:
- Range: \( 0 \leq u_{opt} \leq 0.7 \)
- Increment: 0.1
## Legend
- **ODE**: Blue line
- **KOL-δ**: Red line
- **KOL-m**: Purple line
## Key Trends and Data Points
1. **ODE (Blue)**:
- Starts at \( u_{opt} = 0 \) at \( t = 0 \).
- Rises to \( u_{opt} = 0.3 \) at \( t = 1 \).
- Peaks at \( u_{opt} = 0.4 \) at \( t = 2 \).
- Drops to \( u_{opt} = 0.1 \) at \( t = 3 \).
- Reaches \( u_{opt} = 0 \) at \( t = 4 \).
2. **KOL-δ (Red)**:
- Starts at \( u_{opt} = 0 \) at \( t = 0 \).
- Rises to \( u_{opt} = 0.1 \) at \( t = 1 \).
- Peaks at \( u_{opt} = 0.3 \) at \( t = 2 \).
- Drops to \( u_{opt} = 0.1 \) at \( t = 3 \).
- Reaches \( u_{opt} = 0 \) at \( t = 4 \).
3. **KOL-m (Purple)**:
- Starts at \( u_{opt} = 0 \) at \( t = 0 \).
- Rises to \( u_{opt} = 0.2 \) at \( t = 1 \).
- Peaks at \( u_{opt} = 0.5 \) at \( t = 2 \).
- Drops to \( u_{opt} = 0.1 \) at \( t = 3 \).
- Reaches \( u_{opt} = 0 \) at \( t = 4 \).
## Observations
- All strategies converge to \( u_{opt} = 0 \) by \( t = 5 \).
- **KOL-m** exhibits the highest peak (\( u_{opt} = 0.5 \)) at \( t = 2 \).
- **ODE** and **KOL-δ** show similar trajectories but with lower peak values.
- **KOL-m** demonstrates the most aggressive control response.
## Notes
- The chart uses dashed lines for all strategies, with no additional annotations or gridlines beyond the labeled axes.
- No data table or heatmap is present; all information is conveyed via line plots.