# Technical Diagram Analysis: Distributed Training Synchronization and Failure Points
## 1. Overview
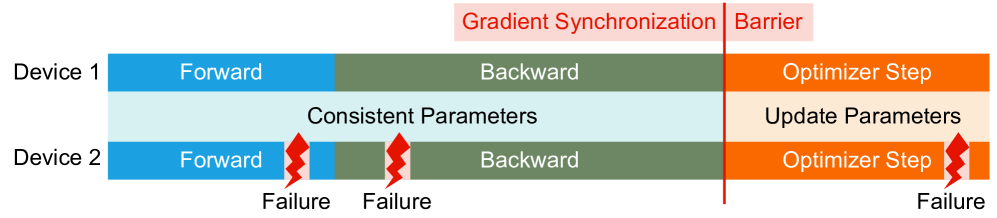
This image is a technical timeline diagram illustrating a synchronized training iteration across two computational devices (Device 1 and Device 2). It highlights the phases of a machine learning training step, the synchronization barriers, and potential failure points during the process.
## 2. Component Isolation
### A. Header / Global Annotations
* **Gradient Synchronization Barrier:** A red vertical line intersects the timeline. Above this line, a light red text box contains the labels:
* **Gradient Synchronization** (Left of the barrier)
* **Barrier** (Right of the barrier)
* **Parameter State (Center Lane):** A light blue/grey horizontal band between Device 1 and Device 2 tracks the state of the model parameters:
* **Consistent Parameters:** Spans the "Forward" and "Backward" phases.
* **Update Parameters:** Spans the "Optimizer Step" phase.
### B. Main Timeline (Device 1)
Device 1 represents a successful, uninterrupted execution of a training step.
* **Phase 1 (Blue):** "Forward" pass.
* **Phase 2 (Green):** "Backward" pass.
* **Phase 3 (Orange):** "Optimizer Step" (Occurs after the synchronization barrier).
### C. Main Timeline (Device 2)
Device 2 represents an execution path prone to interruptions, marked by red lightning bolt icons labeled **"Failure"**.
* **Phase 1 (Blue):** "Forward" pass. Interrupted by a **Failure** near the end of the phase.
* **Phase 2 (Green):** "Backward" pass. Interrupted by a **Failure** at the beginning of the phase.
* **Phase 3 (Orange):** "Optimizer Step". Interrupted by a **Failure** at the very end of the step.
---
## 3. Data Extraction and Flow Logic
### Process Flow Table
| Phase | Color Code | Device 1 Status | Device 2 Status | Parameter State |
| :--- | :--- | :--- | :--- | :--- |
| **Forward** | Blue | Continuous | Interrupted by Failure | Consistent |
| **Backward** | Green | Continuous | Interrupted by Failure | Consistent |
| **Sync Barrier** | Red Line | Reached | Reached | Transition |
| **Optimizer Step** | Orange | Continuous | Interrupted by Failure | Update Parameters |
### Key Trends and Observations
1. **Synchronization Dependency:** The "Optimizer Step" (Orange) for both devices only begins after the "Backward" pass (Green) is completed and the "Gradient Synchronization" barrier is crossed.
2. **Temporal Alignment:** Device 1 and Device 2 are horizontally aligned, indicating they are operating in parallel.
3. **Failure Distribution:** The diagram identifies that failures can occur at any stage of the pipeline:
* During computation (Forward/Backward).
* During the state update (Optimizer Step).
4. **Parameter Consistency:** Parameters remain "Consistent" across devices during the computation of gradients (Forward/Backward) and are only modified ("Update Parameters") during the Optimizer Step following the synchronization barrier.
## 4. Text Transcription
The following text is extracted exactly as it appears in the image:
* **Top Labels:** Gradient Synchronization | Barrier
* **Y-Axis Labels:** Device 1, Device 2
* **Phase Labels (Internal):** Forward, Backward, Optimizer Step
* **Status Labels (Center):** Consistent Parameters, Update Parameters
* **Error Labels:** Failure, Failure, Failure (associated with red lightning bolt icons on Device 2)
---
**Language Declaration:** All text in this image is in **English**.