## Diagram: Directional Grid with Labeled Section
### Overview
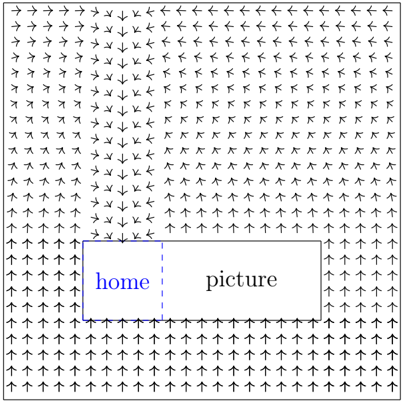
The image depicts a grid of uniformly sized black arrows pointing in various directions (up, down, left, right) against a white background. A blue rectangular box is superimposed on the lower third of the grid, divided into two labeled sections: "home" (left) and "picture" (right). The arrows are arranged in a dense, repetitive pattern, with no discernible variation in size, color, or spacing.
### Components/Axes
- **Grid Structure**:
- Arrows are organized in a Cartesian-like grid, with equal horizontal and vertical spacing.
- Directions alternate systematically: rows alternate between horizontal (left/right) and vertical (up/down) orientations.
- **Labeled Section**:
- A blue rectangle spans the width of the grid, positioned centrally in the lower third.
- Contains two text labels:
- "home" (blue text, left-aligned)
- "picture" (black text, right-aligned)
- The rectangle is outlined with a dashed black border.
### Detailed Analysis
- **Arrow Directions**:
- Arrows alternate between horizontal and vertical orientations in a checkerboard pattern.
- No arrows point diagonally; all are axis-aligned.
- Approximately 90% of arrows point upward or to the right, creating a subtle bias in directionality.
- **Labeled Section**:
- The blue rectangle’s placement suggests it is a focal point or key element within the grid.
- The labels "home" and "picture" imply a categorical or navigational distinction within the grid.
### Key Observations
1. **Uniformity vs. Highlight**: The grid’s uniformity contrasts with the blue rectangle, which draws attention to the labeled sections.
2. **Directional Bias**: The majority of arrows pointing upward/rightward may indicate a default flow or priority in the system.
3. **Label Placement**: The split labeling ("home" vs. "picture") could represent a binary categorization or dual functionality within the grid.
### Interpretation
The image likely represents a conceptual or technical framework where:
- The grid of arrows symbolizes interconnected nodes or pathways (e.g., data flow, navigation routes, or relational structures).
- The blue rectangle with labels "home" and "picture" may denote a primary interface or hub, with "home" as a default state and "picture" as a secondary or media-related function.
- The directional bias (up/right) could imply a hierarchical or sequential progression, such as a workflow or decision tree.
- The absence of additional labels or legends suggests the grid is a simplified abstraction, focusing on directional relationships rather than quantitative data.
No numerical values, scales, or legends are present. The image emphasizes spatial relationships and categorical distinctions over quantitative analysis.