## Chart: EFE2
### Overview
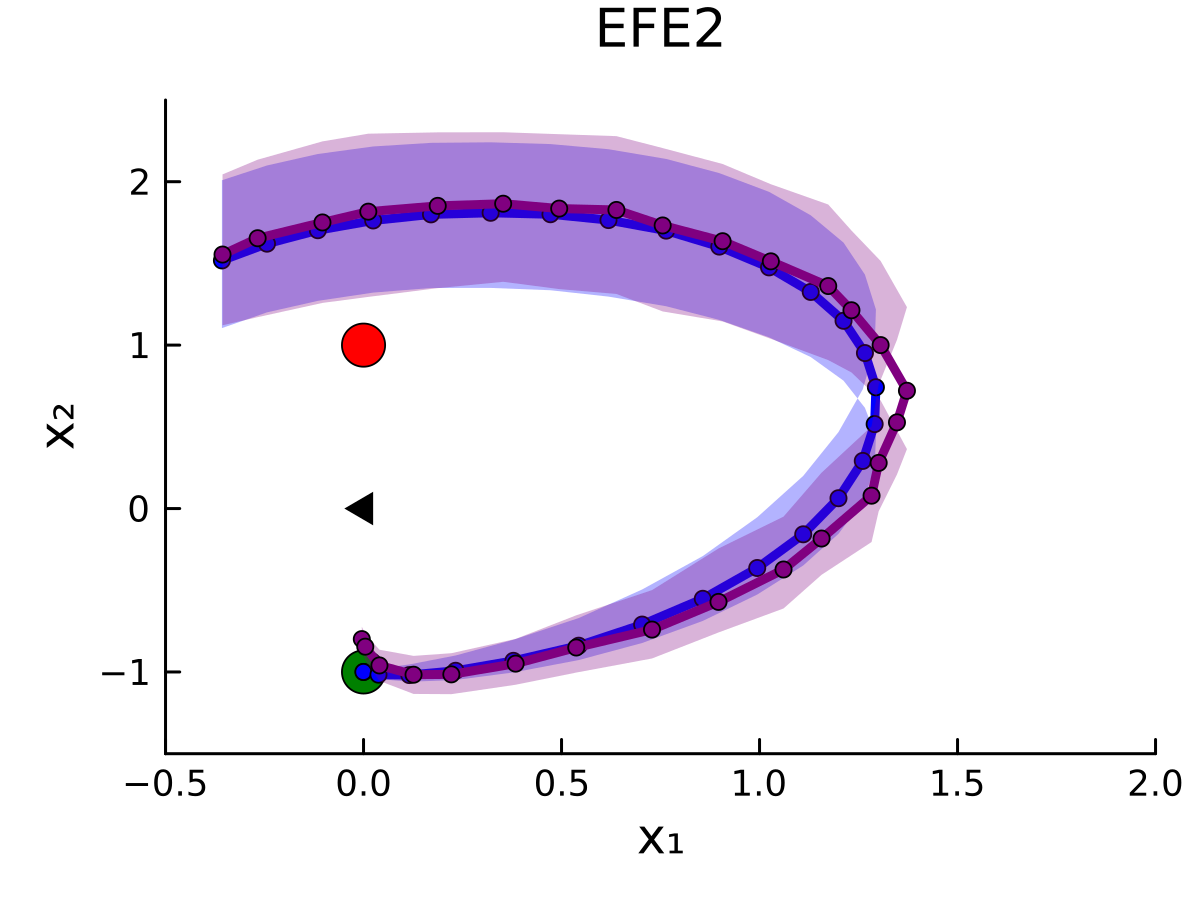
This image displays a 2D coordinate plot titled "EFE2". It visualizes two distinct trajectories (represented by blue and purple lines with circular data points) plotted against an X1 and X2 axis. Additionally, three distinct markers (a red circle, a black triangle, and a green circle) are positioned along the vertical axis at X1 ≈ 0. The plot includes shaded regions around the lines, representing uncertainty or variance in the data.
### Components/Axes
* **Title:** "EFE2" (centered at the top).
* **X-Axis (Horizontal):** Labeled "X1". The scale ranges from -0.5 to 2.0, with major ticks every 0.5 units.
* **Y-Axis (Vertical):** Labeled "X2". The scale ranges from -1 to 2, with major ticks every 1 unit.
* **Data Series:**
* **Blue Series:** A line connecting blue circular markers, surrounded by a light blue shaded region.
* **Purple Series:** A line connecting purple circular markers, surrounded by a light purple shaded region.
* **Markers (positioned at X1 ≈ 0):**
* **Red Circle:** Positioned at X2 ≈ 1.0.
* **Black Triangle:** Positioned at X2 ≈ 0.0.
* **Green Circle:** Positioned at X2 ≈ -1.0.
### Detailed Analysis
The trajectories follow a curved path, starting from the left and looping toward the right before returning to the bottom-left.
**Trend Verification:**
Both the blue and purple lines exhibit a consistent trend:
1. **Start:** Both originate at approximately (-0.4, 1.5).
2. **Ascent:** They curve upward, reaching a peak at approximately (0.4, 1.8).
3. **Descent/Loop:** They curve downward and to the right, reaching a maximum X1 extension of approximately 1.4.
4. **Termination:** Both lines converge toward the bottom-left, ending at approximately (0, -1), which coincides with the location of the green circle marker.
**Data Points & Uncertainty:**
* **Shaded Regions:** The shaded areas represent the variance or confidence interval. The uncertainty is widest during the peak of the arc (around X1 = 0.5 to 1.0) and narrows significantly as the lines approach the terminal point at (0, -1).
* **Overlap:** The blue and purple lines are nearly identical in trajectory, with the purple line appearing slightly offset or "inside" the blue line at the peak of the curve.
### Key Observations
* **Convergence:** Both trajectories terminate precisely at the location of the green circle (0, -1).
* **Vertical Alignment:** The three markers (Red Circle, Black Triangle, Green Circle) are perfectly vertically aligned at X1 = 0.
* **Trajectory Shape:** The paths resemble a "C" shape rotated 90 degrees clockwise, suggesting a system moving from a starting state, performing an action or arc, and returning to a specific target state.
* **Uncertainty:** The variance (shaded regions) is highest in the middle of the trajectory, suggesting the system is most "uncertain" about its position when it is furthest from the start and end points.
### Interpretation
This plot is characteristic of control theory, reinforcement learning, or active inference simulations (often associated with "EFE" or Expected Free Energy).
* **The Trajectories:** The lines likely represent the predicted path of an agent or system state over time. The fact that they loop suggests a movement away from a starting point to explore or perform a task, followed by a return to a goal state.
* **The Markers:** The markers at X1=0 likely represent specific environmental features or states. The green circle at (0, -1) acts as a "goal" or "terminal state" because both trajectories terminate there. The red circle and black triangle may represent obstacles or alternative states that the trajectories avoid.
* **The Shaded Regions:** These represent the epistemic uncertainty of the model. The widening of the shaded area in the middle of the arc suggests that the model is less certain about the state of the system during the "mid-flight" portion of the trajectory compared to the start and end points.
* **Conclusion:** The system demonstrates a high degree of confidence in its start and end states, with a controlled, predictable arc between them, despite a slight variance in the path taken.