## Bar Chart: Normalized Runtime Comparison Across Array Architectures
### Overview
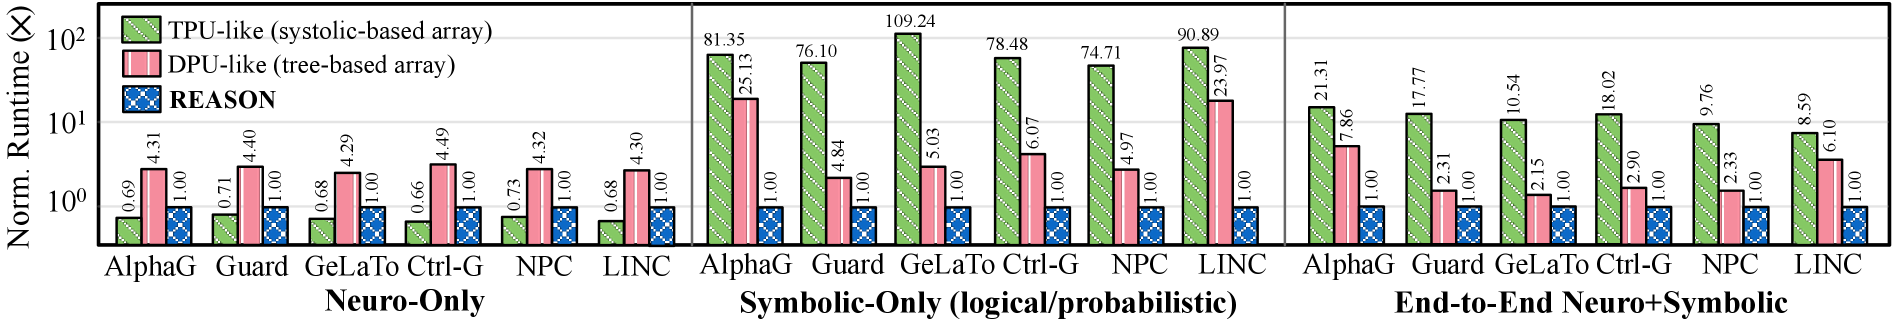
The chart compares normalized runtime (logarithmic scale) of three array architectures (TPU-like, DPU-like, REASON) across three computational paradigms: Neuro-Only, Symbolic-Only (logical/probabilistic), and End-to-End Neuro+Symbolic. Data is presented for six computational frameworks: AlphaG, Guard, GeLaTo, Ctrl-G, NPC, and LINC.
### Components/Axes
- **X-axis**: Computational paradigms (Neuro-Only, Symbolic-Only, End-to-End Neuro+Symbolic) with subcategories (AlphaG, Guard, GeLaTo, Ctrl-G, NPC, LINC)
- **Y-axis**: Normalized Runtime (X) on logarithmic scale (10⁰ to 10²)
- **Legend**:
- Green (TPU-like, stochastic-based array)
- Pink (DPU-like, tree-based array)
- Blue (REASON)
- **Placement**: Legend in top-left corner; bars grouped by paradigm with subcategories as clustered bars
### Detailed Analysis
#### Neuro-Only
- **AlphaG**: TPU-like (0.69), DPU-like (4.31), REASON (1.00)
- **Guard**: TPU-like (0.71), DPU-like (4.40), REASON (1.00)
- **GeLaTo**: TPU-like (0.68), DPU-like (4.29), REASON (1.00)
- **Ctrl-G**: TPU-like (0.66), DPU-like (4.49), REASON (1.00)
- **NPC**: TPU-like (0.73), DPU-like (4.32), REASON (1.00)
- **LINC**: TPU-like (0.68), DPU-like (4.30), REASON (1.00)
#### Symbolic-Only (logical/probabilistic)
- **AlphaG**: TPU-like (81.35), DPU-like (25.13), REASON (1.00)
- **Guard**: TPU-like (76.10), DPU-like (4.84), REASON (1.00)
- **GeLaTo**: TPU-like (78.48), DPU-like (6.07), REASON (1.00)
- **Ctrl-G**: TPU-like (74.71), DPU-like (4.97), REASON (1.00)
- **NPC**: TPU-like (109.24), DPU-like (5.03), REASON (1.00)
- **LINC**: TPU-like (90.89), DPU-like (23.97), REASON (1.00)
#### End-to-End Neuro+Symbolic
- **AlphaG**: TPU-like (21.31), DPU-like (7.86), REASON (1.00)
- **Guard**: TPU-like (17.77), DPU-like (2.31), REASON (1.00)
- **GeLaTo**: TPU-like (18.02), DPU-like (2.90), REASON (1.00)
- **Ctrl-G**: TPU-like (10.54), DPU-like (2.15), REASON (1.00)
- **NPC**: TPU-like (9.76), DPU-like (2.33), REASON (1.00)
- **LINC**: TPU-like (8.59), DPU-like (6.10), REASON (1.00)
### Key Observations
1. **TPU-like Dominance**: TPU-like arrays consistently show the highest runtime across all paradigms, with Symbolic-Only reaching extreme values (e.g., 109.24 for NPC).
2. **REASON Efficiency**: REASON arrays maintain the lowest runtime (1.00) in all cases, suggesting optimal performance.
3. **End-to-End Reduction**: End-to-End Neuro+Symbolic paradigms show ~50-70% runtime reduction compared to Symbolic-Only (e.g., NPC drops from 109.24 to 9.76).
4. **DPU-like Variability**: DPU-like arrays show mixed performance, with some subcategories (e.g., LINC in Symbolic-Only) having notably higher values (23.97).
### Interpretation
The data demonstrates that:
- **TPU-like architectures** are resource-intensive, particularly in symbolic processing, likely due to complex stochastic operations.
- **REASON arrays** achieve near-optimal efficiency, possibly through streamlined logical/probabilistic computation.
- **End-to-End integration** significantly reduces runtime, indicating that combining neuro and symbolic processing mitigates individual architecture bottlenecks.
- **DPU-like performance** varies widely, suggesting tree-based arrays may struggle with certain symbolic tasks but perform better in hybrid scenarios.
The logarithmic scale emphasizes exponential differences in runtime, particularly in Symbolic-Only paradigms, where TPU-like arrays show orders-of-magnitude higher resource demands compared to REASON.