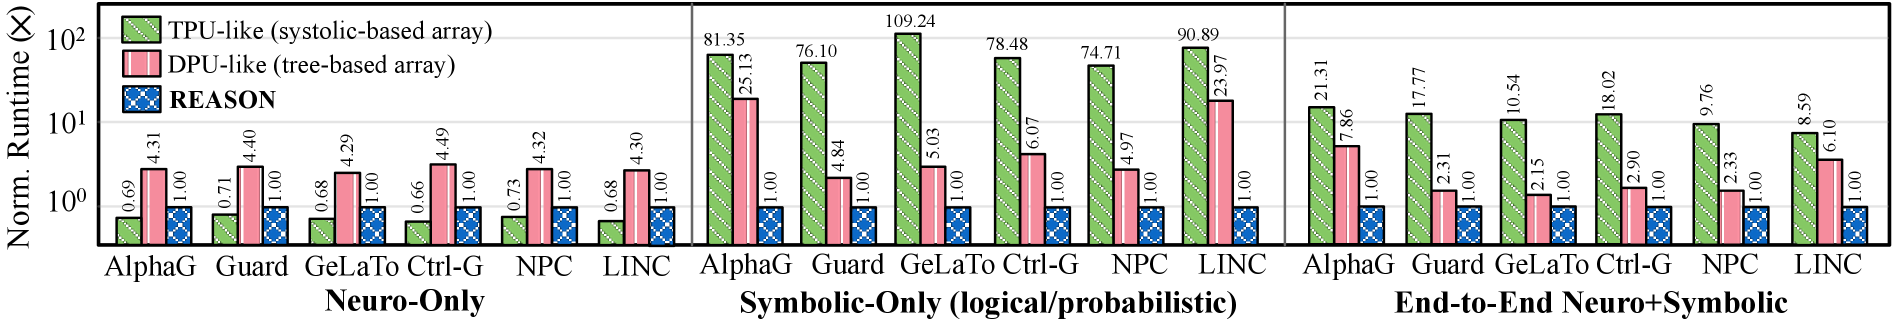
\n
## Bar Chart: Normalized Runtime Comparison of Different Architectures
### Overview
This bar chart compares the normalized runtime (denoted as "Norm. Runtime (x)") of several neural network architectures (AlphaG, Guard, GelatoToCtrl-G, NPC, LINC) across three different categories: Neuro-Only, Symbolic-Only (logical/probabilistic), and End-to-End Neuro+Symbolic. Each architecture is represented by two bars: one for a TPU-like (systolic-based array) and one for a DPU-like (tree-based array). The y-axis is on a logarithmic scale.
### Components/Axes
* **X-axis:** Represents the different architectures and categories. The categories are:
* Neuro-Only: AlphaG, Guard, GelatoToCtrl-G, NPC, LINC
* Symbolic-Only (logical/probabilistic): AlphaG, Guard, GelatoToCtrl-G, NPC, LINC
* End-to-End Neuro+Symbolic: AlphaG, Guard, GelatoToCtrl-G, NPC, LINC
* **Y-axis:** "Norm. Runtime (x)" on a logarithmic scale (base 10). The scale ranges from approximately 0.5 to 110.
* **Legend:** Located at the top-left corner, distinguishing between:
* TPU-like (systolic-based array) - Green bars with diagonal hatching.
* DPU-like (tree-based array) - Pink bars with diagonal hatching.
* **Title:** "REASON" is present in a yellow box above the chart.
### Detailed Analysis
The chart consists of 30 bars (5 architectures x 2 array types x 3 categories). Here's a breakdown of the approximate normalized runtime values for each combination, referencing the legend colors for verification:
**Neuro-Only:**
* AlphaG (TPU): ~0.69
* AlphaG (DPU): ~4.31
* Guard (TPU): ~0.71
* Guard (DPU): ~4.40
* GelatoToCtrl-G (TPU): ~0.68
* GelatoToCtrl-G (DPU): ~4.29
* NPC (TPU): ~0.66
* NPC (DPU): ~4.49
* LINC (TPU): ~0.73
* LINC (DPU): ~4.32
**Symbolic-Only (logical/probabilistic):**
* AlphaG (TPU): ~81.35
* AlphaG (DPU): ~25.13
* Guard (TPU): ~109.24
* Guard (DPU): ~76.10
* GelatoToCtrl-G (TPU): ~5.03
* GelatoToCtrl-G (DPU): ~78.48
* NPC (TPU): ~1.00
* NPC (DPU): ~74.71
* LINC (TPU): ~0.67
* LINC (DPU): ~23.97
**End-to-End Neuro+Symbolic:**
* AlphaG (TPU): ~7.86
* AlphaG (DPU): ~21.31
* Guard (TPU): ~11.77
* Guard (DPU): ~10.54
* GelatoToCtrl-G (TPU): ~2.31
* GelatoToCtrl-G (DPU): ~18.02
* NPC (TPU): ~1.00
* NPC (DPU): ~9.76
* LINC (TPU): ~2.90
* LINC (DPU): ~8.59
**Trends:**
* **TPU vs. DPU:** Generally, the DPU-like arrays have significantly higher normalized runtimes than the TPU-like arrays, especially in the Symbolic-Only and End-to-End categories.
* **Category Impact:** The normalized runtime increases dramatically when moving from Neuro-Only to Symbolic-Only. The End-to-End category shows intermediate values.
* **Architecture Variation:** Within each category, the normalized runtime varies considerably between the different architectures.
### Key Observations
* The largest runtime values are observed for Guard with the TPU-like array in the Symbolic-Only category (~109.24).
* NPC consistently shows a runtime of 1.00 for the TPU-like array in both the Symbolic-Only and End-to-End categories.
* The Neuro-Only category has the lowest normalized runtimes, generally below 5.
* The DPU-like arrays consistently show higher runtimes than the TPU-like arrays.
### Interpretation
This chart demonstrates the performance trade-offs between different neural network architectures and hardware platforms (TPU vs. DPU) when performing different types of reasoning tasks (Neuro-Only, Symbolic-Only, End-to-End). The substantial increase in runtime for the Symbolic-Only category suggests that symbolic reasoning is significantly more computationally expensive than purely neural processing, at least for these architectures and hardware. The End-to-End approach attempts to bridge the gap, but still exhibits higher runtimes than the Neuro-Only approach. The consistent performance of NPC with a runtime of 1.00 on the TPU-like array in the Symbolic-Only and End-to-End categories suggests it may be a particularly efficient architecture for these tasks on this hardware. The difference in performance between TPU and DPU suggests that the systolic array architecture of the TPU is better suited for these workloads than the tree-based architecture of the DPU. The "REASON" title suggests the chart is evaluating architectures for reasoning tasks. The logarithmic scale emphasizes the large differences in runtime, particularly for the Symbolic-Only category.