## Scatter Plot: Performance Comparison of ESN vs. LSTM Models
### Overview
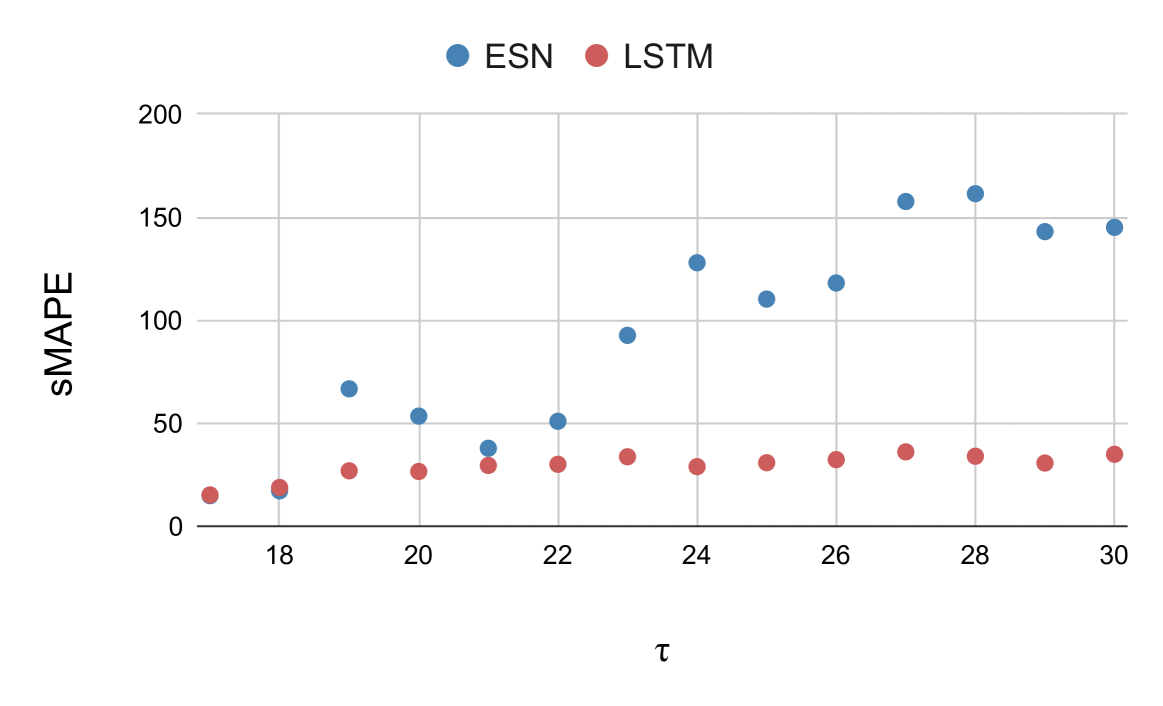
This image is a scatter plot comparing the performance of two machine learning models, **ESN** (Echo State Network) and **LSTM** (Long Short-Term Memory), across a range of values for the parameter **$\tau$** (tau). The performance is measured using **sMAPE** (Symmetric Mean Absolute Percentage Error), where lower values indicate better model performance.
### Components/Axes
* **Y-Axis (Vertical):** Labeled "sMAPE". The scale ranges from 0 to 200, with major grid lines at intervals of 50.
* **X-Axis (Horizontal):** Labeled "$\tau$". The scale ranges from 17 to 30 (implied by the data points), with major grid lines labeled at 18, 20, 22, 24, 26, 28, and 30.
* **Legend:** Located at the top center.
* **Blue Circle:** Represents the **ESN** model.
* **Red Circle:** Represents the **LSTM** model.
### Detailed Analysis
The data points are plotted at integer intervals for $\tau$ from 17 to 30. Below are the approximate values for sMAPE for each model:
| $\tau$ | ESN (Blue) sMAPE | LSTM (Red) sMAPE |
| :--- | :--- | :--- |
| **17** | ~15 | ~15 |
| **18** | ~18 | ~18 |
| **19** | ~68 | ~26 |
| **20** | ~54 | ~26 |
| **21** | ~38 | ~28 |
| **22** | ~52 | ~30 |
| **23** | ~93 | ~33 |
| **24** | ~128 | ~28 |
| **25** | ~112 | ~30 |
| **26** | ~118 | ~32 |
| **27** | ~158 | ~35 |
| **28** | ~162 | ~33 |
| **29** | ~143 | ~30 |
| **30** | ~145 | ~34 |
**Trend Verification:**
* **LSTM (Red):** The trend is relatively flat and stable. It maintains a low sMAPE (between ~15 and ~35) across the entire range of $\tau$, showing high robustness.
* **ESN (Blue):** The trend is highly volatile and shows a general upward slope. While it starts at parity with LSTM at $\tau=17-18$, it diverges sharply at $\tau=19$ and continues to exhibit significant fluctuations and an overall increase in error as $\tau$ increases.
### Key Observations
* **Performance Parity:** At low values of $\tau$ (17 and 18), both models perform almost identically with very low sMAPE values.
* **Divergence:** Starting at $\tau=19$, the ESN model's error increases significantly, while the LSTM model remains stable.
* **Volatility:** The ESN model exhibits high variance in its error rate (e.g., dropping from ~128 at $\tau=24$ to ~112 at $\tau=25$, then rising again), whereas the LSTM model shows a very consistent, tight clustering of error values.
* **Outliers/Anomalies:** The ESN model shows a distinct "spike" in error at $\tau=24$ and $\tau=27-28$, suggesting instability in the model's predictive capability at these specific parameter settings.
### Interpretation
The data demonstrates that the **LSTM model is significantly more robust and accurate** than the ESN model for this specific task as the parameter $\tau$ increases.
* **Model Suitability:** The ESN model appears to be highly sensitive to the $\tau$ parameter. Its performance degrades rapidly as $\tau$ increases, suggesting it may struggle to capture long-term dependencies or patterns in the data as the embedding dimension or time lag grows.
* **Stability:** The LSTM model's consistent performance suggests it is better suited for this dataset, as it maintains a low error rate regardless of the $\tau$ value.
* **Peircean Investigative Note:** The divergence at $\tau=19$ acts as a "critical point." Before this point, the models are indistinguishable. After this point, the ESN's failure to maintain low error suggests a fundamental limitation in the ESN architecture's ability to handle the complexity introduced by higher $\tau$ values, whereas the LSTM architecture successfully generalizes across the tested range.