\n
## Scatter Plot: sMAPE vs. τ for ESN and LSTM
### Overview
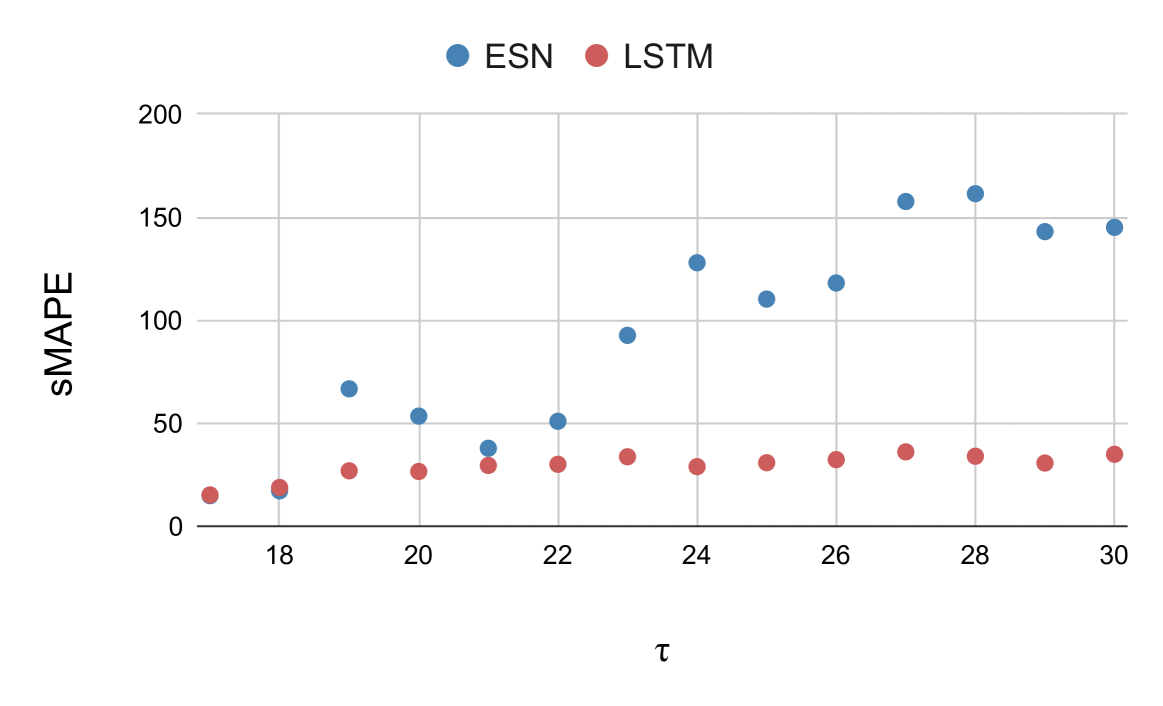
This image presents a scatter plot comparing the Symmetric Mean Absolute Percentage Error (sMAPE) performance of two recurrent neural network models, Echo State Networks (ESN) and Long Short-Term Memory networks (LSTM), across a range of values for the parameter τ (tau). The plot visualizes the relationship between τ and sMAPE for each model, allowing for a comparison of their performance.
### Components/Axes
* **X-axis:** τ (tau) - ranging from approximately 17.5 to 30.5.
* **Y-axis:** sMAPE - ranging from 0 to 200.
* **Data Series 1:** ESN - represented by blue circles.
* **Data Series 2:** LSTM - represented by red circles.
* **Legend:** Located in the top-center of the plot, clearly identifying the color-coding for ESN and LSTM.
### Detailed Analysis
**ESN (Blue Circles):**
The ESN data points generally exhibit an upward trend.
* At τ ≈ 18.5, sMAPE ≈ 10.
* At τ ≈ 19.5, sMAPE ≈ 50.
* At τ ≈ 21, sMAPE ≈ 50.
* At τ ≈ 22.5, sMAPE ≈ 100.
* At τ ≈ 23.5, sMAPE ≈ 130.
* At τ ≈ 25, sMAPE ≈ 115.
* At τ ≈ 26.5, sMAPE ≈ 120.
* At τ ≈ 28, sMAPE ≈ 160.
* At τ ≈ 29, sMAPE ≈ 140.
* At τ ≈ 30, sMAPE ≈ 145.
**LSTM (Red Circles):**
The LSTM data points appear more scattered and generally remain at lower sMAPE values compared to ESN.
* At τ ≈ 18.5, sMAPE ≈ 20.
* At τ ≈ 19.5, sMAPE ≈ 30.
* At τ ≈ 21, sMAPE ≈ 35.
* At τ ≈ 22.5, sMAPE ≈ 40.
* At τ ≈ 23.5, sMAPE ≈ 30.
* At τ ≈ 25, sMAPE ≈ 30.
* At τ ≈ 26.5, sMAPE ≈ 30.
* At τ ≈ 28, sMAPE ≈ 35.
* At τ ≈ 29, sMAPE ≈ 30.
* At τ ≈ 30, sMAPE ≈ 30.
### Key Observations
* ESN consistently exhibits higher sMAPE values than LSTM across the observed range of τ.
* The sMAPE for ESN increases significantly as τ increases, indicating a potential degradation in performance with larger τ values.
* LSTM's sMAPE remains relatively stable across the range of τ, suggesting it is less sensitive to changes in this parameter.
* There is a clear divergence in performance between the two models, with LSTM generally outperforming ESN.
### Interpretation
The data suggests that LSTM is a more robust model than ESN for this particular task, as its performance (measured by sMAPE) is less affected by variations in the parameter τ. The increasing sMAPE for ESN with increasing τ indicates that the model may become unstable or less accurate as τ grows. This could be due to the echo state property being violated at higher τ values, leading to uncontrolled dynamics within the reservoir. The consistent lower sMAPE of LSTM suggests that its gating mechanisms effectively manage the flow of information, preventing the vanishing or exploding gradient problems that can plague RNNs and contribute to performance degradation. The plot highlights the importance of parameter tuning and model selection in achieving optimal performance in time series forecasting or sequence modeling tasks. The difference in performance could also be related to the specific dataset used for training and evaluation, and further investigation would be needed to determine the generalizability of these findings.