# Technical Document Extraction: Line Chart Analysis
## Chart Overview
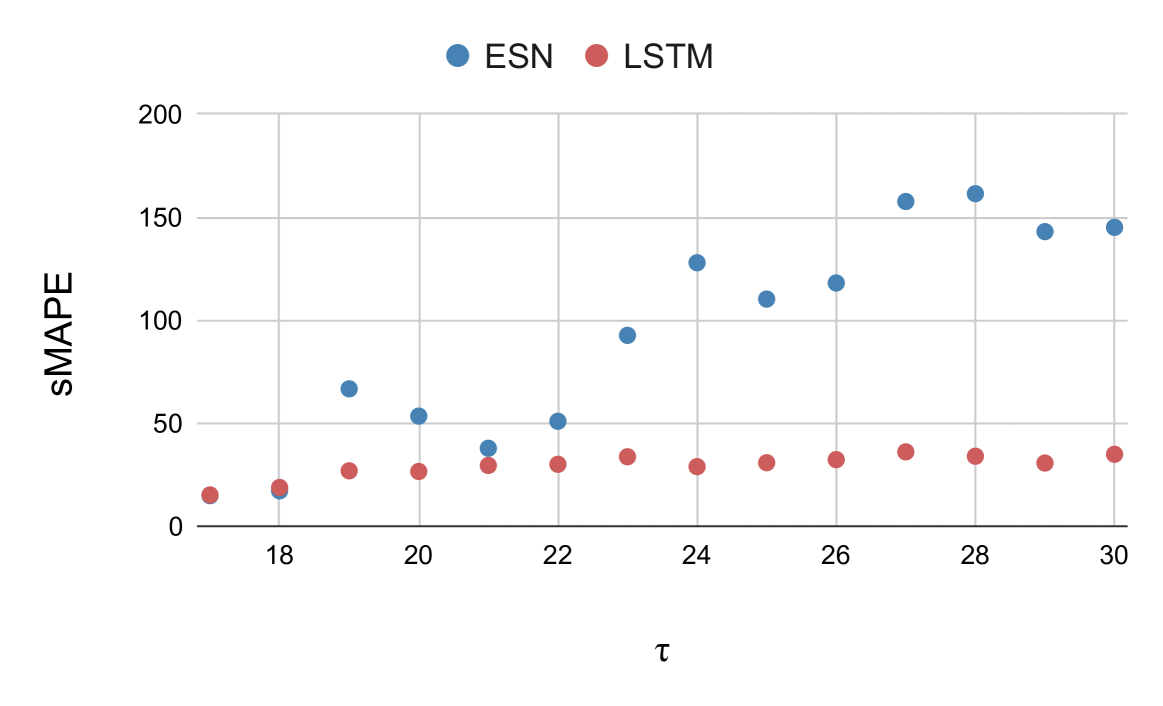
The image depicts a line chart comparing two data series over a numerical axis labeled **τ**. The chart includes:
- **Legend**: Located at the top center, with color-coded labels:
- **Blue**: ESN
- **Red**: LSTM
- **Axes**:
- **X-axis**: Labeled **τ**, with integer markers from 18 to 30.
- **Y-axis**: Labeled **sMAPE**, with numerical markers from 0 to 200 in increments of 50.
## Data Series Analysis
### ESN (Blue)
- **Trend**: Exhibits an overall upward trajectory with fluctuations. Peaks at τ=28 (165) and τ=30 (150), with a notable dip at τ=29 (145).
- **Data Points**:
- τ=18: 15
- τ=19: 65
- τ=20: 55
- τ=21: 40
- τ=22: 50
- τ=23: 95
- τ=24: 130
- τ=25: 110
- τ=26: 120
- τ=27: 160
- τ=28: 165
- τ=29: 145
- τ=30: 150
### LSTM (Red)
- **Trend**: Relatively stable with minor fluctuations. Peaks at τ=27 (35) and τ=30 (35), with a low at τ=18 (10).
- **Data Points**:
- τ=18: 10
- τ=19: 25
- τ=20: 28
- τ=21: 30
- τ=22: 30
- τ=23: 35
- τ=24: 28
- τ=25: 30
- τ=26: 32
- τ=27: 35
- τ=28: 33
- τ=29: 30
- τ=30: 35
## Spatial Grounding
- **Legend Position**: Top center of the chart.
- **Data Point Colors**:
- Blue points correspond to ESN.
- Red points correspond to LSTM.
## Key Observations
1. **ESN vs. LSTM**: ESN values are consistently higher than LSTM across all τ values.
2. **τ=28**: ESN reaches its maximum (165), while LSTM shows a slight dip (33).
3. **τ=18**: Both series start at their lowest values (ESN: 15, LSTM: 10).
## Notes
- No additional text, tables, or diagrams are present in the image.
- The chart focuses on comparing the performance of ESN and LSTM models using the sMAPE metric.