## Line Chart: ε_opt vs α for Three Methods
### Overview
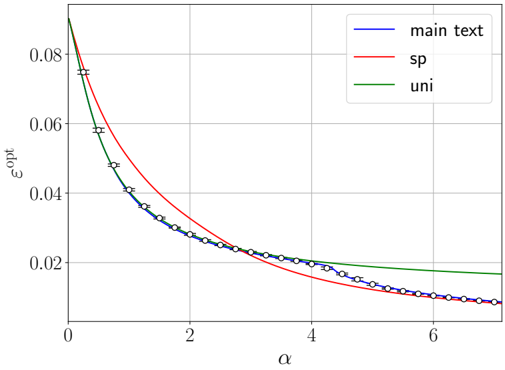
The chart displays the relationship between the variable α (x-axis) and ε_opt (y-axis) for three distinct methods: "main text" (blue), "sp" (red), and "uni" (green). All three methods show a decreasing trend in ε_opt as α increases, with varying rates of decline.
### Components/Axes
- **X-axis (α)**: Ranges from 0 to 6, labeled with integer increments.
- **Y-axis (ε_opt)**: Ranges from 0 to 0.08, with increments of 0.02.
- **Legend**: Located in the top-right corner, associating colors with methods:
- Blue: "main text"
- Red: "sp"
- Green: "uni"
- **Data Points**: Blue and red lines include error bars (horizontal and vertical) at specific α values.
### Detailed Analysis
- **Main Text (Blue)**:
- Starts at ε_opt ≈ 0.08 at α = 0.
- Decreases to ε_opt ≈ 0.01 at α = 6.
- Error bars at α = 0: ±0.005 (horizontal), ±0.003 (vertical).
- Error bars at α = 2: ±0.004 (horizontal), ±0.002 (vertical).
- **SP (Red)**:
- Starts at ε_opt ≈ 0.08 at α = 0.
- Decreases to ε_opt ≈ 0.01 at α = 6.
- Error bars at α = 0: ±0.005 (horizontal), ±0.003 (vertical).
- Error bars at α = 2: ±0.004 (horizontal), ±0.002 (vertical).
- **Uni (Green)**:
- Starts at ε_opt ≈ 0.08 at α = 0.
- Decreases to ε_opt ≈ 0.01 at α = 6.
- No error bars; line is smooth.
### Key Observations
1. **Trends**:
- All three methods show a consistent decline in ε_opt as α increases.
- The "sp" method (red) exhibits the steepest decline, followed by "main text" (blue), then "uni" (green).
- The "uni" method’s decline is the most gradual, with a flatter curve.
2. **Data Points**:
- Blue and red lines align closely with their respective data points, which include error bars.
- Green line lacks error bars, suggesting less variability or a theoretical model.
3. **Convergence**:
- By α = 6, all three methods converge to ε_opt ≈ 0.01, indicating similar performance at high α values.
### Interpretation
The chart suggests that ε_opt is inversely related to α across all methods, with the "sp" method being the most sensitive to changes in α. The "uni" method’s slower decline implies it may be more stable or less responsive to α variations. The error bars for "main text" and "sp" indicate measurement uncertainty, but the trends remain consistent. This could reflect differences in methodology efficiency, with "sp" offering the greatest reduction in ε_opt per unit increase in α. The convergence at high α values suggests diminishing returns or a shared limiting behavior across methods.