# Technical Document Extraction: Line Chart Analysis
## Chart Type
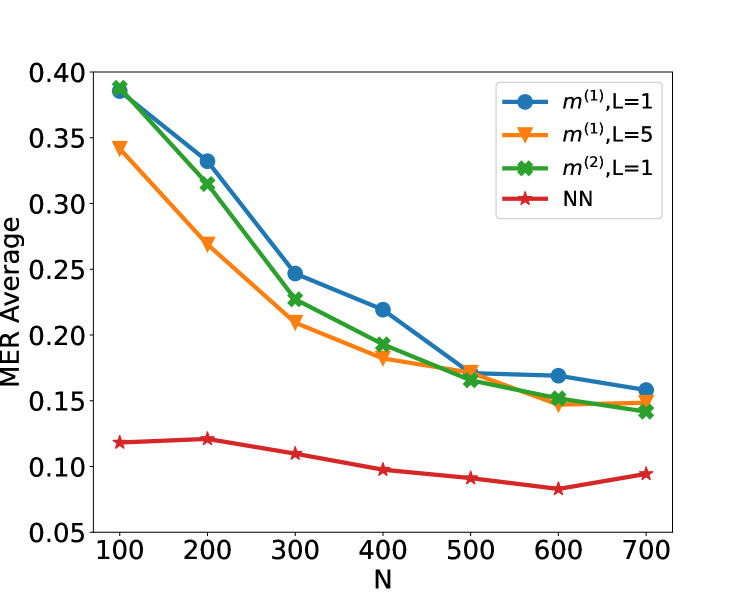
Line chart with four data series plotted against a numerical axis.
## Axis Labels
- **X-axis**: Labeled "N" with tick marks at 100, 200, 300, 400, 500, 600, 700.
- **Y-axis**: Labeled "MER Average" with increments of 0.05 (0.05, 0.10, 0.15, 0.20, 0.25, 0.30, 0.35, 0.40).
## Legend
- **Location**: Top-right corner of the chart.
- **Entries**:
1. **Blue circles**: `m^(1),L=1`
2. **Orange triangles**: `m^(1),L=5`
3. **Green crosses**: `m^(2),L=1`
4. **Red stars**: `NN`
## Data Series Trends
1. **Blue Line (`m^(1),L=1`)**:
- **Trend**: Steep downward slope from ~0.39 at N=100 to ~0.16 at N=700.
- **Key Points**:
- N=100: ~0.39
- N=200: ~0.33
- N=300: ~0.25
- N=400: ~0.22
- N=500: ~0.18
- N=600: ~0.17
- N=700: ~0.16
2. **Orange Line (`m^(1),L=5`)**:
- **Trend**: Gradual decline from ~0.34 at N=100 to ~0.15 at N=700.
- **Key Points**:
- N=100: ~0.34
- N=200: ~0.28
- N=300: ~0.21
- N=400: ~0.19
- N=500: ~0.17
- N=600: ~0.15
- N=700: ~0.15
3. **Green Line (`m^(2),L=1`)**:
- **Trend**: Steep initial drop, then gradual flattening from ~0.39 at N=100 to ~0.15 at N=700.
- **Key Points**:
- N=100: ~0.39
- N=200: ~0.32
- N=300: ~0.23
- N=400: ~0.20
- N=500: ~0.17
- N=600: ~0.16
- N=700: ~0.15
4. **Red Line (`NN`)**:
- **Trend**: Nearly flat with a slight dip from ~0.12 at N=100 to ~0.09 at N=600, then a minor rise to ~0.10 at N=700.
- **Key Points**:
- N=100: ~0.12
- N=200: ~0.12
- N=300: ~0.11
- N=400: ~0.10
- N=500: ~0.095
- N=600: ~0.09
- N=700: ~0.10
## Spatial Grounding
- **Legend Position**: Top-right corner (coordinates: [x=0.8, y=0.9] relative to chart boundaries).
- **Data Point Verification**:
- Blue circles (`m^(1),L=1`) consistently match the blue line.
- Orange triangles (`m^(1),L=5`) align with the orange line.
- Green crosses (`m^(2),L=1`) correspond to the green line.
- Red stars (`NN`) track the red line.
## Component Isolation
- **Header**: Chart title (not explicitly labeled but inferred as "MER Average vs. N").
- **Main Chart**: Four data series with distinct markers and colors.
- **Footer**: No additional text or annotations.
## Critical Observations
- All data series show a general decline in MER Average as N increases, except `NN`, which remains relatively stable.
- `m^(1),L=1` (blue) and `m^(2),L=1` (green) exhibit the steepest declines, suggesting higher sensitivity to N.
- `NN` (red) demonstrates the least variability, indicating potential robustness or baseline performance.
## Data Table Reconstruction
| N | m^(1),L=1 | m^(1),L=5 | m^(2),L=1 | NN |
|------|-----------|-----------|-----------|-----|
| 100 | 0.39 | 0.34 | 0.39 | 0.12|
| 200 | 0.33 | 0.28 | 0.32 | 0.12|
| 300 | 0.25 | 0.21 | 0.23 | 0.11|
| 400 | 0.22 | 0.19 | 0.20 | 0.10|
| 500 | 0.18 | 0.17 | 0.17 | 0.095|
| 600 | 0.17 | 0.15 | 0.16 | 0.09|
| 700 | 0.16 | 0.15 | 0.15 | 0.10|
## Language Declaration
- **Primary Language**: English (all labels, axis titles, and legends are in English).