# Technical Document Extraction: GPU Throughput Analysis
## Chart Description
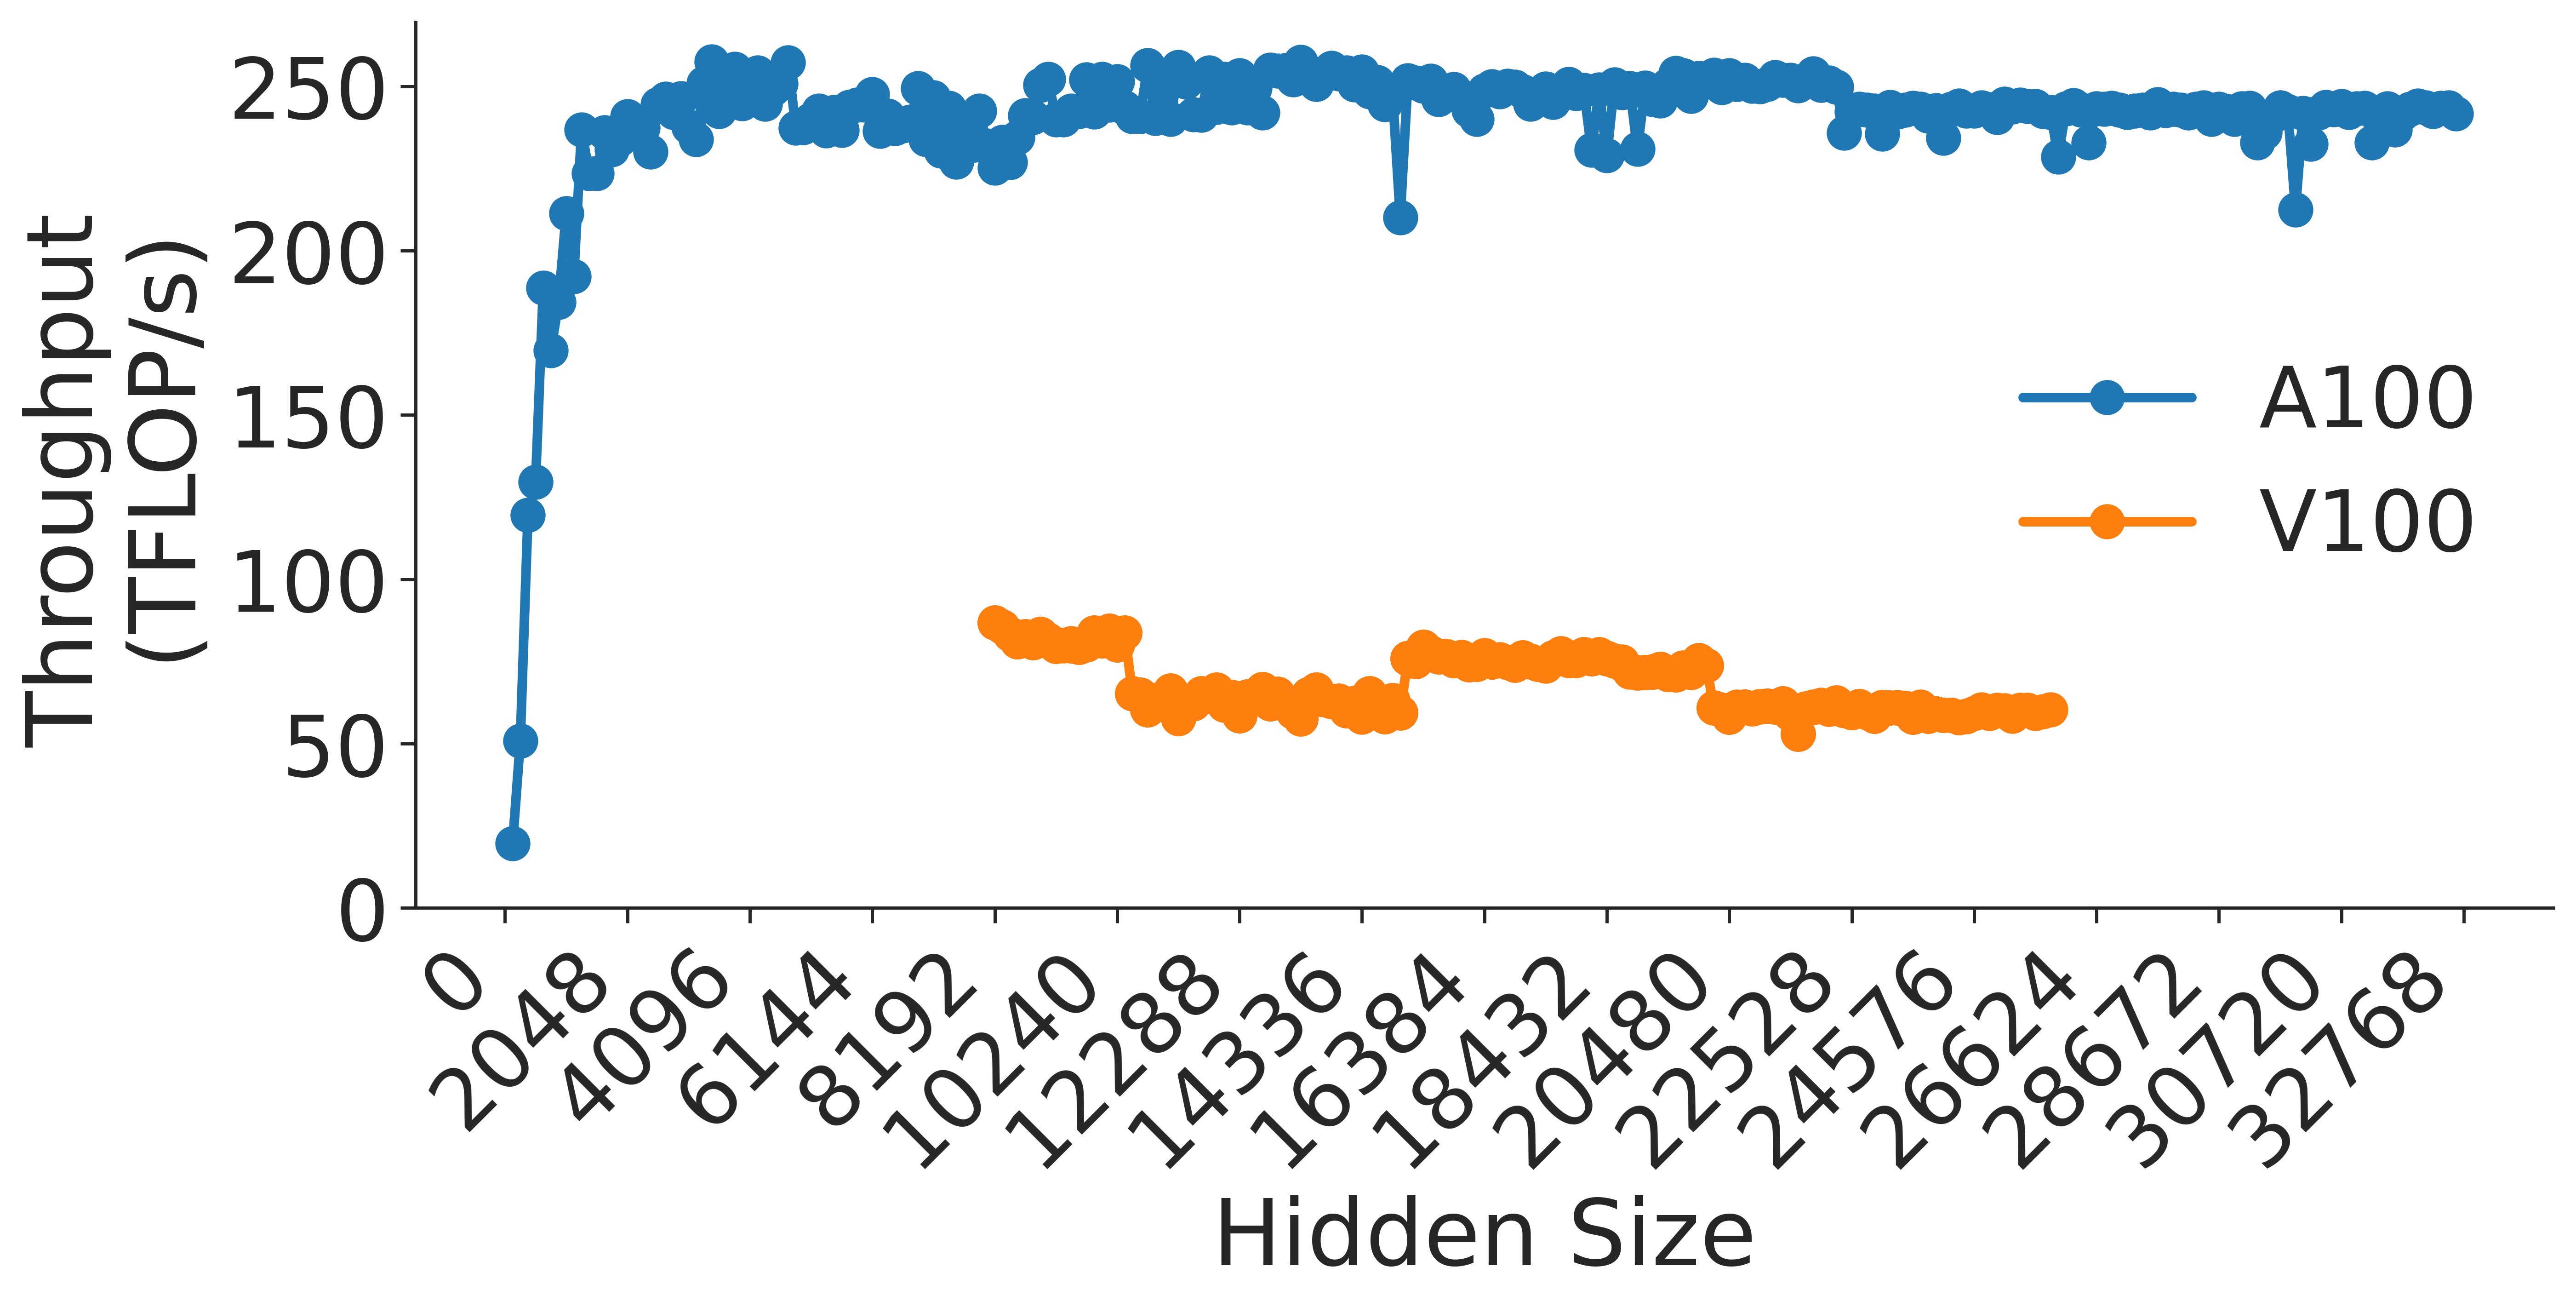
This image is a **line chart** comparing the throughput (in TFLOP/s) of two GPU architectures (A100 and V100) across varying hidden sizes. The chart emphasizes performance trends as hidden size increases.
---
### Labels and Axis Titles
- **Y-Axis**: "Throughput (TFLOP/s)"
- Scale: 0 to 250 (increments of 50)
- **X-Axis**: "Hidden Size"
- Scale: 0 to 32768 (increments of 2048)
---
### Legend
- **Location**: Right side of the chart
- **Labels**:
- **Blue (solid line with circles)**: A100
- **Orange (dashed line with circles)**: V100
---
### Data Trends
#### A100 (Blue)
- **Initial Behavior**:
- Starts at **20 TFLOP/s** at hidden size **2048**.
- Sharp increase to **~250 TFLOP/s** by hidden size **4096**.
- **Stabilization**:
- Maintains **~250 TFLOP/s** plateau from hidden size **4096** to **32768**.
- Minor dips observed at hidden sizes **12288**, **16384**, and **24576**, but no sustained deviation from the plateau.
#### V100 (Orange)
- **Initial Behavior**:
- Starts at **0 TFLOP/s** at hidden size **0**.
- Jumps to **~80 TFLOP/s** at hidden size **10240**.
- **Mid-Range Behavior**:
- Maintains **~80 TFLOP/s** plateau from hidden size **10240** to **16384**.
- **Drop**:
- Declines to **~60 TFLOP/s** at hidden size **20480**.
- **Final Behavior**:
- Stabilizes at **~60 TFLOP/s** from hidden size **20480** to **32768**.
---
### Key Observations
1. **Performance Gap**:
- A100 consistently outperforms V100 across all hidden sizes.
- At hidden size **32768**, A100 achieves **~250 TFLOP/s**, while V100 achieves **~60 TFLOP/s**.
2. **Scalability**:
- A100 demonstrates near-linear scaling up to hidden size **4096**, then plateaus.
- V100 shows limited scalability, with performance peaking at hidden size **10240** and declining thereafter.
3. **Efficiency**:
- A100 maintains high throughput even at the largest hidden size (**32768**).
- V100’s performance drops significantly at hidden sizes beyond **16384**, suggesting architectural limitations.
---
### Spatial Grounding
- **Legend Position**: Right-aligned, outside the plot area.
- **Data Point Colors**:
- All A100 data points match the **blue** legend marker.
- All V100 data points match the **orange** legend marker.
---
### Conclusion
The chart highlights A100’s superior throughput and scalability compared to V100, particularly at larger hidden sizes. V100’s performance plateaus early and declines at higher hidden sizes, indicating potential inefficiencies in handling larger computational loads.