## Bar Chart: Validation Accuracy Comparison
### Overview
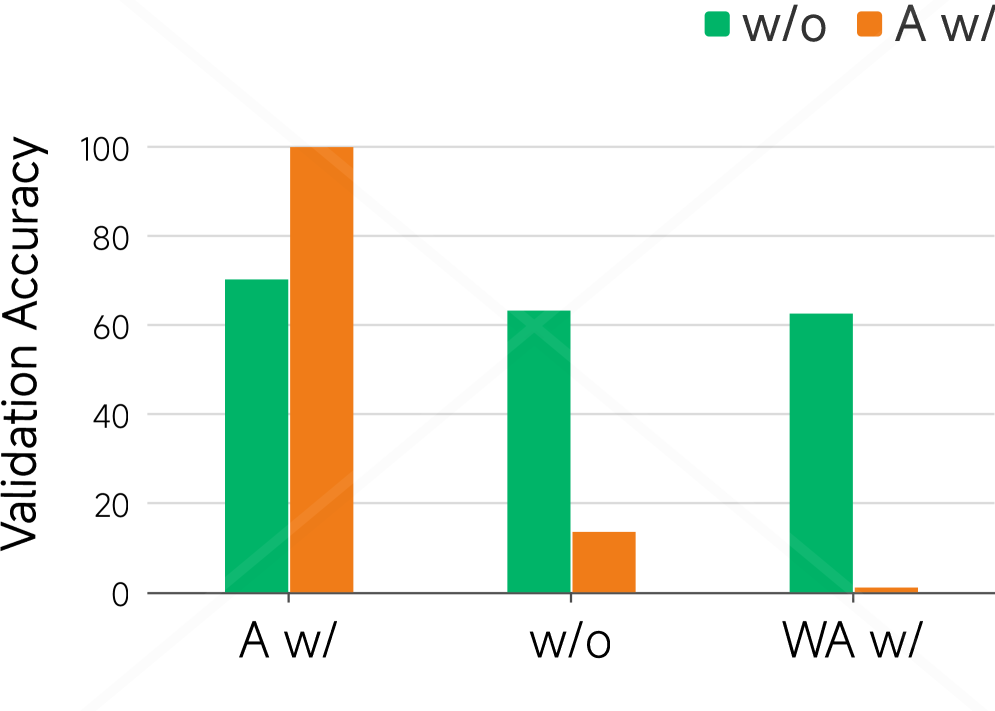
The image is a bar chart comparing validation accuracy under different conditions, labeled as "A w/", "w/o", and "WA w/". The chart displays two data series: "w/o" (represented by green bars) and "A w/" (represented by orange bars).
### Components/Axes
* **Y-axis:** "Validation Accuracy" with a scale from 0 to 100, incrementing by 20.
* **X-axis:** Categorical axis with three categories: "A w/", "w/o", and "WA w/".
* **Legend:** Located at the top-right of the chart.
* Green square: "w/o"
* Orange square: "A w/"
### Detailed Analysis
Here's a breakdown of the bar heights for each category and data series:
* **A w/:**
* "w/o" (Green): Approximately 72%
* "A w/" (Orange): Approximately 100%
* **w/o:**
* "w/o" (Green): Approximately 64%
* "A w/" (Orange): Approximately 14%
* **WA w/:**
* "w/o" (Green): Approximately 64%
* "A w/" (Orange): Approximately 1%
### Key Observations
* For the "A w/" category, the "A w/" data series (orange) shows significantly higher validation accuracy (100%) compared to the "w/o" data series (green, 72%).
* For the "w/o" category, the "w/o" data series (green) shows significantly higher validation accuracy (64%) compared to the "A w/" data series (orange, 14%).
* For the "WA w/" category, the "w/o" data series (green) shows significantly higher validation accuracy (64%) compared to the "A w/" data series (orange, 1%).
### Interpretation
The chart suggests that the "A w/" condition results in the highest validation accuracy when "A w/" is applied, while the "w/o" condition results in higher accuracy when "w/o" is applied. The "WA w/" condition shows a high validation accuracy when "w/o" is applied, but a very low validation accuracy when "A w/" is applied. This indicates a potential interaction or dependency between the conditions and their impact on validation accuracy. The "WA w/" condition seems to strongly favor the "w/o" data series.