\n
## Bar Chart: Validation Accuracy Comparison
### Overview
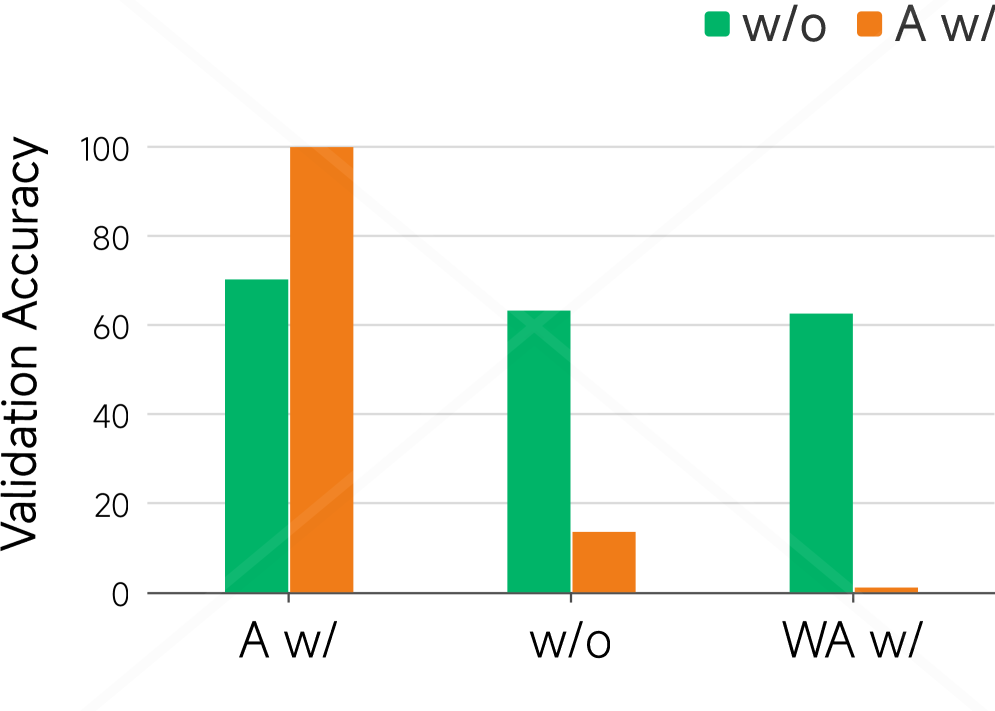
This bar chart compares the validation accuracy of a model under different conditions, specifically with and without a certain feature or technique (indicated by "A w/" and "w/o"). The chart displays validation accuracy on the y-axis and three different conditions on the x-axis.
### Components/Axes
* **Y-axis Title:** Validation Accuracy
* **X-axis Labels:** "A w/", "w/o", "WA w/"
* **Legend:**
* Green: w/o (approximately)
* Orange: A w/ (approximately)
### Detailed Analysis
The chart consists of three groups of bars, each representing one of the x-axis labels. Each group contains two bars, one green ("w/o") and one orange ("A w/").
* **"A w/" Group:**
* Green bar ("w/o"): The height of the green bar is approximately 70.
* Orange bar ("A w/"): The height of the orange bar is approximately 98.
* **"w/o" Group:**
* Green bar ("w/o"): The height of the green bar is approximately 63.
* Orange bar ("A w/"): The height of the orange bar is approximately 16.
* **"WA w/" Group:**
* Green bar ("w/o"): The height of the green bar is approximately 63.
* Orange bar ("A w/"): There is no orange bar for this group.
The y-axis scale ranges from 0 to 100.
### Key Observations
* For the "A w/" condition, the "A w/" (orange) bar significantly outperforms the "w/o" (green) bar.
* For the "w/o" condition, the "w/o" (green) bar significantly outperforms the "A w/" (orange) bar.
* The "WA w/" condition only has a "w/o" (green) bar, indicating that the "A w/" condition was not tested or is not applicable in this scenario.
* The validation accuracy values are all between 16 and 98.
### Interpretation
The data suggests that the feature or technique represented by "A w/" has a positive impact on validation accuracy when applied in the "A w/" condition, increasing accuracy from approximately 70 to 98. However, when applied in the "w/o" condition, it *decreases* validation accuracy from approximately 63 to 16. This indicates that the effectiveness of "A w/" is highly dependent on the context or underlying conditions. The absence of an "A w/" bar for "WA w/" suggests that this feature is not compatible or relevant in that specific scenario. The chart highlights the importance of considering the interaction between features and the overall system when evaluating performance. The "WA w/" condition may represent a different dataset or experimental setup where "A w/" is not applicable.