## Grouped Bar Chart: Validation Accuracy Comparison
### Overview
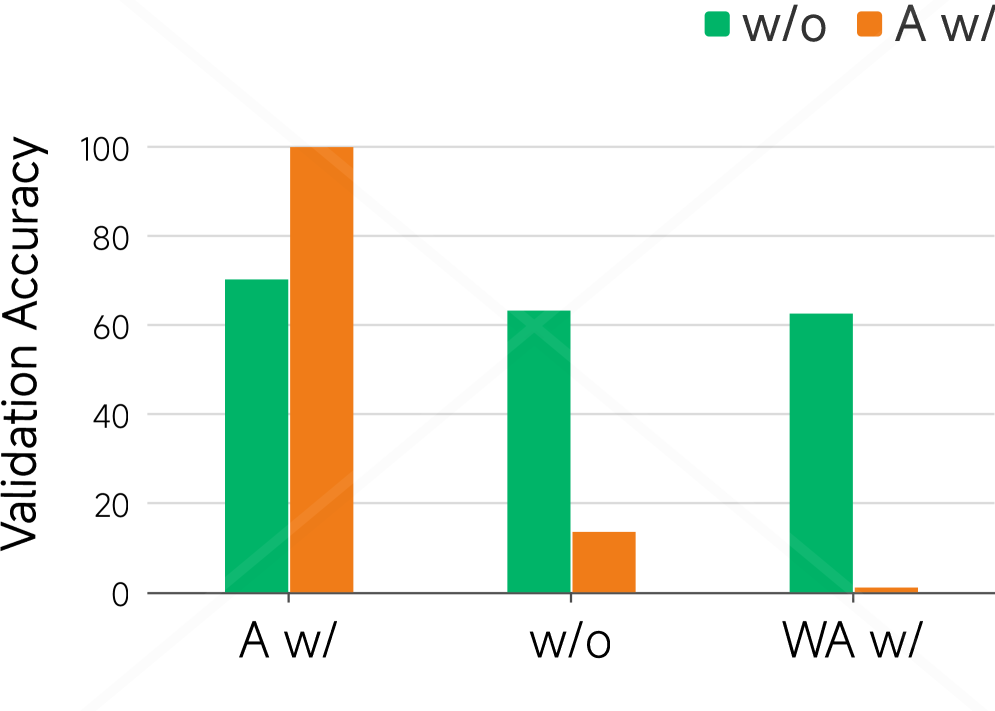
The image displays a grouped bar chart comparing "Validation Accuracy" across three different categories or conditions. Each category features two bars representing two distinct data series, identified by color. The chart visually demonstrates a significant inverse relationship between the two series across the categories.
### Components/Axes
* **Chart Type:** Grouped vertical bar chart.
* **Y-Axis:**
* **Label:** "Validation Accuracy" (rotated vertically on the left side).
* **Scale:** Linear scale from 0 to 100, with major gridlines at intervals of 20 (0, 20, 40, 60, 80, 100).
* **X-Axis:**
* **Categories (from left to right):** "A w/", "w/o", "WA w/".
* **Legend:**
* **Position:** Top-right corner of the chart area.
* **Series 1:** Green square, labeled "w/o".
* **Series 2:** Orange square, labeled "A w/".
* **Data Series:**
* **Green Bars:** Represent the "w/o" series.
* **Orange Bars:** Represent the "A w/" series.
### Detailed Analysis
**Category 1: "A w/" (Leftmost group)**
* **Green Bar ("w/o"):** Height is approximately 70. The top of the bar aligns midway between the 60 and 80 gridlines.
* **Orange Bar ("A w/"):** Height is exactly at the 100 gridline, indicating maximum validation accuracy.
**Category 2: "w/o" (Middle group)**
* **Green Bar ("w/o"):** Height is approximately 63. The top is slightly above the 60 gridline.
* **Orange Bar ("A w/"):** Height is approximately 14. The top is below the 20 gridline, closer to 10 than to 20.
**Category 3: "WA w/" (Rightmost group)**
* **Green Bar ("w/o"):** Height is approximately 62, very similar to the green bar in the "w/o" category.
* **Orange Bar ("A w/"):** Height is very low, approximately 1. It is barely visible above the 0 baseline.
### Key Observations
1. **Inverse Performance Trend:** There is a clear inverse relationship between the two series. In the first category ("A w/"), the orange "A w/" series performs exceptionally well (100), while the green "w/o" series is moderate (~70). In the subsequent categories ("w/o" and "WA w/"), this relationship flips: the green "w/o" series maintains a consistent, moderate accuracy (~62-63), while the orange "A w/" series performance collapses dramatically (to ~14 and ~1, respectively).
2. **Stability vs. Volatility:** The "w/o" (green) series shows relatively stable performance across all three categories, with accuracy varying only within a narrow band (~62 to ~70). In contrast, the "A w/" (orange) series is highly volatile, ranging from perfect accuracy (100) to near-zero accuracy (~1).
3. **Category-Specific Anomaly:** The "A w/" category is the only condition where the "A w/" (orange) series outperforms the "w/o" (green) series. In the other two categories, the "w/o" series is dominant.
### Interpretation
This chart likely compares the performance of a model or system under different experimental conditions or with/without certain features (denoted by "w/" for "with" and "w/o" for "without").
* The data suggests that the condition or feature labeled "A w/" is **highly beneficial and critical** for performance in the specific context of the first category ("A w/"), enabling perfect accuracy. However, this same "A w/" component appears to be **severely detrimental or incompatible** in the contexts of the "w/o" and "WA w/" categories, causing performance to plummet.
* The "w/o" (green) series represents a more **robust and generalizable** baseline. Its performance is consistent regardless of the category, indicating it is less sensitive to the changing conditions represented by the x-axis labels.
* The label "WA w/" for the third category might imply a combination or a different variant ("WA") that includes the "A" component. The near-total failure of the orange "A w/" series in this category reinforces the interpretation that the "A" component, while powerful in one specific setup, disrupts function in others.
* **Conclusion:** The chart demonstrates a classic trade-off or specificity scenario. The "A w/" approach offers peak performance in a narrow, specific scenario but lacks robustness. The "w/o" approach offers reliable, moderate performance across a wider range of scenarios. The choice between them would depend on whether the application prioritizes peak performance in a known condition or consistent performance across variable conditions.