## Bar Chart: Validation Accuracy Comparison
### Overview
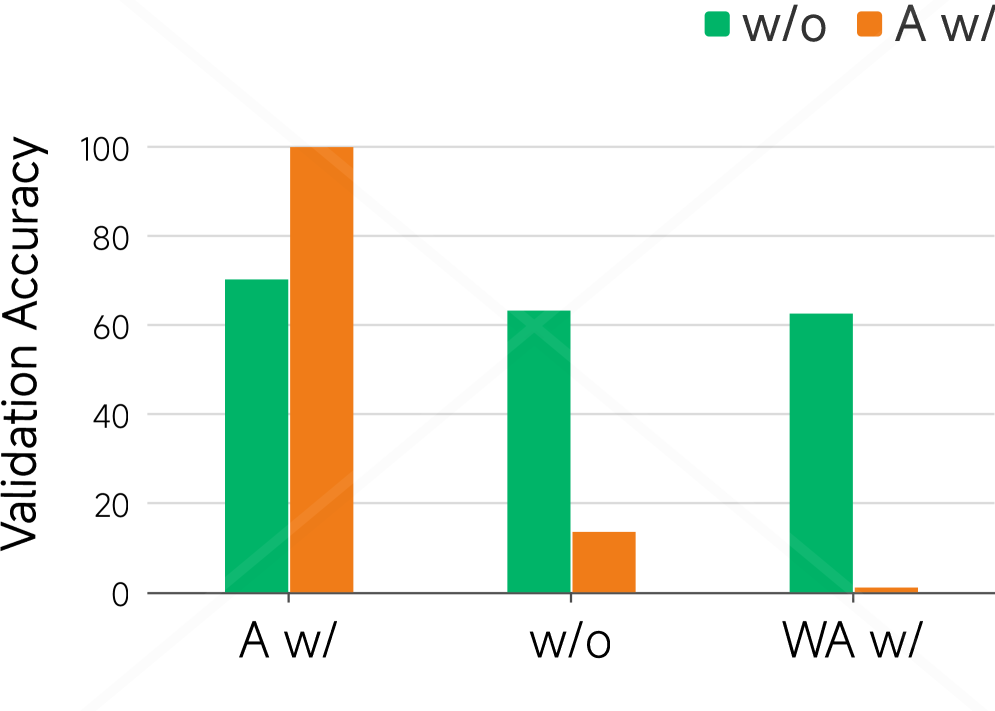
The chart compares validation accuracy across three categories ("A w/", "w/o", "WA w/") using two data series: "w/o" (green) and "A w/" (orange). The y-axis represents validation accuracy (0–100), while the x-axis lists the categories. The legend is positioned in the top-right corner.
### Components/Axes
- **X-axis**: Categories labeled "A w/", "w/o", and "WA w/".
- **Y-axis**: "Validation Accuracy" with increments of 20 (0, 20, 40, 60, 80, 100).
- **Legend**:
- Green square labeled "w/o".
- Orange square labeled "A w/".
- **Bars**:
- Green bars represent "w/o" data.
- Orange bars represent "A w/" data.
### Detailed Analysis
1. **Category "A w/"**:
- Orange bar ("A w/"): ~100 accuracy.
- Green bar ("w/o"): ~70 accuracy.
2. **Category "w/o"**:
- Green bar ("w/o"): ~65 accuracy.
- Orange bar ("A w/"): ~15 accuracy.
3. **Category "WA w/"**:
- Green bar ("w/o"): ~63 accuracy.
- Orange bar ("A w/"): ~2 accuracy.
### Key Observations
- The orange bar ("A w/") in "A w/" dominates with near-perfect accuracy (~100).
- In "w/o", the orange bar ("A w/") drops sharply to ~15, while the green bar ("w/o") remains moderate (~65).
- "WA w/" shows minimal accuracy for both series, with the orange bar ("A w/") nearly negligible (~2).
### Interpretation
The data suggests that the "A w/" configuration significantly impacts validation accuracy, particularly in the "A w/" and "w/o" categories. The near-perfect accuracy in "A w/" implies that the "A" component is critical for performance. The drastic drop in "w/o" highlights the dependency on "A" for maintaining accuracy. "WA w/" underperforms across both series, indicating that "WA" may not contribute meaningfully to the model's effectiveness. The orange bars ("A w/") consistently outperform green bars ("w/o"), reinforcing the importance of the "A" factor. This could reflect architectural, algorithmic, or data-related advantages tied to "A".