# Technical Document Extraction: GPT-4 vs Prometheus Eval
## Image Description
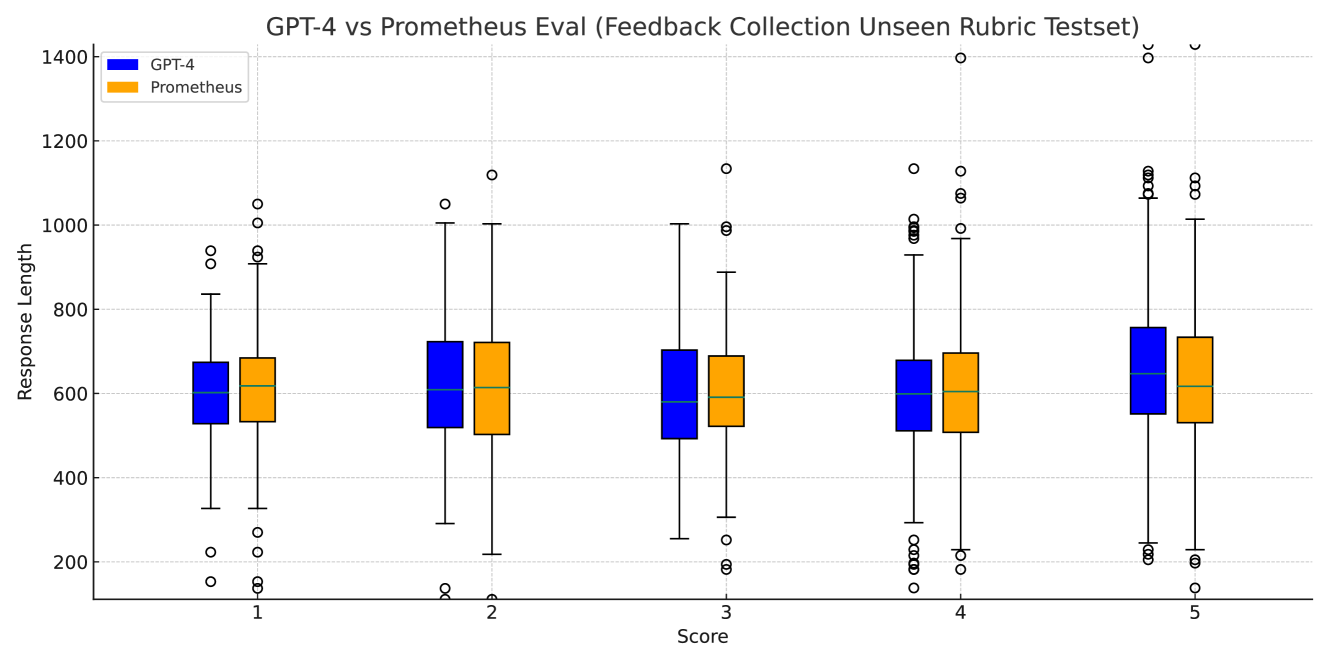
The image is a comparative box plot chart titled **"GPT-4 vs Prometheus Eval (Feedback Collection Unseen Rubric Testset)"**. It visualizes response length distributions for two systems (GPT-4 and Prometheus) across five scores (1–5). The chart uses distinct colors for each system: **blue for GPT-4** and **orange for Prometheus**.
---
## Key Components
### 1. **Legend**
- **Position**: Top-left corner.
- **Labels**:
- Blue: GPT-4
- Orange: Prometheus
### 2. **Axes**
- **X-axis**: Labeled **"Score"**, with discrete categories **1, 2, 3, 4, 5**.
- **Y-axis**: Labeled **"Response Length"**, ranging from **0 to 1400** in increments of 200.
### 3. **Box Plot Structure**
Each score (1–5) has two box plots (one per system). Components include:
- **Median**: Green line within each box.
- **Interquartile Range (IQR)**: Box boundaries (25th–75th percentiles).
- **Whiskers**: Extend to 1.5×IQR from the box edges.
- **Outliers**: Marked as individual dots beyond whiskers.
---
## Data Trends
### GPT-4 (Blue)
- **Score 1**: Median ~650, IQR ~550–700, outliers at ~200 and ~900.
- **Score 2**: Median ~700, IQR ~600–750, outliers at ~150 and ~1050.
- **Score 3**: Median ~650, IQR ~550–700, outliers at ~200 and ~1000.
- **Score 4**: Median ~650, IQR ~550–700, outliers at ~150 and ~1000.
- **Score 5**: Median ~700, IQR ~600–750, outliers at ~1400 and ~1100.
### Prometheus (Orange)
- **Score 1**: Median ~600, IQR ~500–650, outliers at ~200 and ~850.
- **Score 2**: Median ~650, IQR ~550–700, outliers at ~150 and ~1050.
- **Score 3**: Median ~600, IQR ~500–650, outliers at ~200 and ~950.
- **Score 4**: Median ~650, IQR ~550–700, outliers at ~150 and ~1000.
- **Score 5**: Median ~650, IQR ~550–700, outliers at ~200 and ~1100.
---
## Observations
1. **Median Response Length**:
- GPT-4 consistently has higher medians than Prometheus across all scores (e.g., Score 5: GPT-4 ~700 vs. Prometheus ~650).
- The largest gap occurs at Score 5 (~50 units difference).
2. **Variability**:
- Both systems show similar IQRs, but GPT-4 exhibits more extreme outliers (e.g., ~1400 at Score 5).
3. **Outliers**:
- GPT-4 has more frequent and extreme outliers (e.g., ~1400 at Score 5).
- Prometheus has fewer outliers, with the highest at ~1100 (Score 5).
4. **Overlap**:
- At Scores 3 and 4, the IQRs of both systems overlap significantly (~550–700).
---
## Spatial Grounding
- **Legend**: Top-left corner (confirmed via visual alignment).
- **Axis Titles**: Centered above/below axes (standard box plot conventions).
- **Data Points**: All dots (outliers) align with their respective system colors.
---
## Language Notes
- **Primary Language**: English (all labels, titles, and annotations).
- **No Additional Languages Detected**.
---
## Conclusion
The chart demonstrates that GPT-4 generally produces longer responses than Prometheus, with higher variability and more extreme outliers. Prometheus shows more consistent response lengths but lower median values. This suggests GPT-4 may prioritize depth over conciseness in unseen rubric tasks.