## Chart: Agent Performance Comparison
### Overview
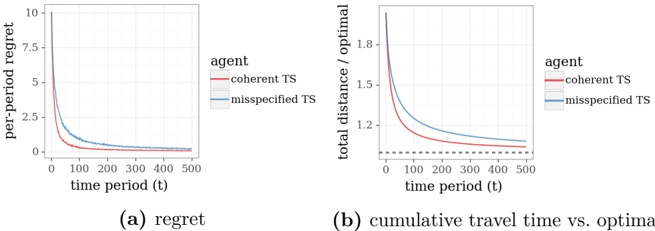
The image presents two line charts comparing the performance of two agents, "coherent TS" and "misspecified TS," over time. The left chart (a) shows the per-period regret, while the right chart (b) shows the cumulative travel time vs. optimal. Both charts display the performance of the two agents over 500 time periods.
### Components/Axes
**Left Chart (a): Regret**
* **Title:** per-period regret
* **X-axis:** time period (t), with markers at 0, 100, 200, 300, 400, and 500.
* **Y-axis:** per-period regret, with markers at 0, 2.5, 5, 7.5, and 10.
* **Legend (Top-Right):**
* Red line: coherent TS
* Blue line: misspecified TS
**Right Chart (b): Cumulative Travel Time vs. Optimal**
* **Title:** total distance / optimal
* **X-axis:** time period (t), with markers at 0, 100, 200, 300, 400, and 500.
* **Y-axis:** total distance / optimal, with markers at 1.2, 1.5, and 1.8.
* **Legend (Top-Right):**
* Red line: coherent TS
* Blue line: misspecified TS
* A dashed horizontal line is present at y=1.0.
### Detailed Analysis
**Left Chart (a): Regret**
* **Coherent TS (Red):** The regret starts at approximately 2.5 and decreases rapidly, approaching 0 after around 200 time periods.
* **Misspecified TS (Blue):** The regret starts at approximately 5 and decreases rapidly, approaching 0 after around 200 time periods.
**Right Chart (b): Cumulative Travel Time vs. Optimal**
* **Coherent TS (Red):** The total distance/optimal starts at approximately 1.5 and decreases, approaching 1.1 after 500 time periods.
* **Misspecified TS (Blue):** The total distance/optimal starts at approximately 1.9 and decreases, approaching 1.15 after 500 time periods.
### Key Observations
* Both agents show a decrease in per-period regret and total distance/optimal over time.
* The misspecified TS agent initially has a higher regret and total distance/optimal compared to the coherent TS agent.
* Both agents' performance converges over time, with their regret approaching 0 and their total distance/optimal approaching a similar value.
### Interpretation
The charts demonstrate the learning behavior of the two agents. Initially, the "misspecified TS" agent performs worse, indicating that its initial model or assumptions are not well-aligned with the environment. However, as both agents interact with the environment over time, they learn and adapt, leading to a reduction in regret and a decrease in the ratio of total distance to optimal distance. The convergence of performance suggests that both agents are eventually able to find near-optimal solutions, even if they start from different initial states or with different models. The dashed line at y=1.0 in the right chart represents the optimal travel time, and the agents are approaching this value as time progresses.