## Line Charts: Performance Comparison of Two Agents
### Overview
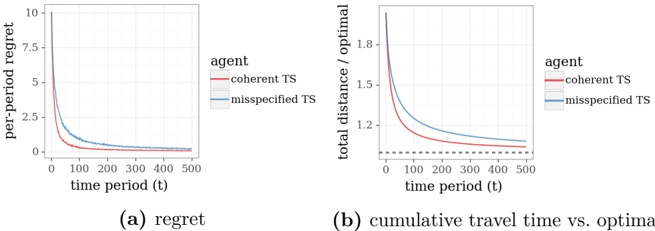
The image contains two side-by-side line charts comparing the performance of two agents, "coherent TS" and "misspecified TS," over 500 time periods. The charts are labeled (a) and (b) at the bottom. The overall theme is a performance evaluation, likely from a reinforcement learning or optimization study, showing how different metrics evolve over time.
### Components/Axes
**Common Elements:**
* **X-axis (both charts):** Labeled "time period (t)". The scale runs from 0 to 500, with major tick marks at 0, 100, 200, 300, 400, and 500.
* **Legend (both charts):** Located to the right of each plot area. It defines two data series:
* `coherent TS` - Represented by a solid red line.
* `misspecified TS` - Represented by a solid blue line.
* **Chart Labels:** The charts are labeled below as "(a) regret" and "(b) cumulative travel time vs. optimal".
**Chart-Specific Elements:**
* **Chart (a) - Left:**
* **Y-axis:** Labeled "per-period regret". The scale runs from 0 to 10, with major tick marks at 0, 2.5, 5.0, 7.5, and 10.0.
* **Chart (b) - Right:**
* **Y-axis:** Labeled "total distance / optimal". The scale runs from approximately 1.0 to 1.9, with major tick marks at 1.2, 1.5, and 1.8.
* **Additional Element:** A horizontal dashed black line is present at y = 1.0, extending across the entire width of the plot.
### Detailed Analysis
**Chart (a): Per-Period Regret**
* **Trend Verification:** Both lines show a steep, decaying trend. They start at a high value near t=0 and decrease rapidly, approaching zero as time progresses. The red line (`coherent TS`) is consistently below the blue line (`misspecified TS`) for all visible time periods.
* **Data Points (Approximate):**
* At t=0: Both lines start near the top of the y-axis. `coherent TS` (red) ≈ 10.0, `misspecified TS` (blue) ≈ 10.0.
* At t=50: `coherent TS` (red) ≈ 2.0, `misspecified TS` (blue) ≈ 3.0.
* At t=100: `coherent TS` (red) ≈ 1.0, `misspecified TS` (blue) ≈ 1.5.
* At t=200: `coherent TS` (red) ≈ 0.3, `misspecified TS` (blue) ≈ 0.5.
* At t=500: Both lines are very close to 0, with `coherent TS` (red) marginally lower.
**Chart (b): Total Distance / Optimal**
* **Trend Verification:** Both lines show a decaying trend, starting high and decreasing towards the horizontal dashed line at y=1.0. The red line (`coherent TS`) is consistently below the blue line (`misspecified TS`).
* **Data Points (Approximate):**
* At t=0: Both lines start near the top of the y-axis. `coherent TS` (red) ≈ 1.9, `misspecified TS` (blue) ≈ 1.9.
* At t=50: `coherent TS` (red) ≈ 1.35, `misspecified TS` (blue) ≈ 1.55.
* At t=100: `coherent TS` (red) ≈ 1.20, `misspecified TS` (blue) ≈ 1.35.
* At t=200: `coherent TS` (red) ≈ 1.10, `misspecified TS` (blue) ≈ 1.20.
* At t=500: `coherent TS` (red) ≈ 1.05, `misspecified TS` (blue) ≈ 1.10. Both are approaching but remain above the dashed line at 1.0.
### Key Observations
1. **Consistent Performance Gap:** In both metrics, the `coherent TS` agent (red line) outperforms the `misspecified TS` agent (blue line) at every observed time point. The gap is most pronounced in the early periods (t < 100).
2. **Convergence Behavior:** Both agents show learning or optimization behavior, as their performance metrics improve (decrease) over time. They appear to be converging towards an optimal state (regret → 0, distance ratio → 1).
3. **Asymptotic Performance:** By t=500, the `coherent TS` agent is very close to the optimal baseline in both charts, while the `misspecified TS` agent still shows a small but measurable performance deficit.
4. **Baseline Reference:** Chart (b) includes a clear optimal baseline (dashed line at y=1.0), indicating that a value of 1.0 represents perfect performance (total distance equals the optimal distance).
### Interpretation
The data demonstrates the superior performance of the "coherent TS" agent compared to the "misspecified TS" agent in a sequential decision-making task over 500 time periods.
* **What the data suggests:** The "coherent TS" agent learns more efficiently, achieving lower per-period regret and a total travel distance closer to the optimal solution much faster. The "misspecified TS" agent, while also learning, consistently incurs higher costs (regret and sub-optimal distance), suggesting its internal model or policy is less accurate or well-aligned with the true environment.
* **How elements relate:** The two charts provide complementary views of performance. Chart (a) shows the immediate, step-by-step cost of sub-optimal decisions (regret), while chart (b) shows the cumulative consequence of those decisions relative to a perfect benchmark. The consistent ordering of the lines across both charts reinforces the conclusion that one agent is fundamentally better.
* **Notable patterns/anomalies:** The most significant pattern is the persistent performance gap. There are no crossovers or anomalies where the misspecified agent outperforms the coherent one. The rapid initial improvement followed by a long tail of refinement is characteristic of many learning algorithms. The fact that the `misspecified TS` agent's curve in chart (b) remains visibly above 1.0 even at t=500 indicates a persistent, albeit small, inefficiency that may not be fully resolvable with its given model.