## Line Graphs: Agent Performance Metrics Over Time
### Overview
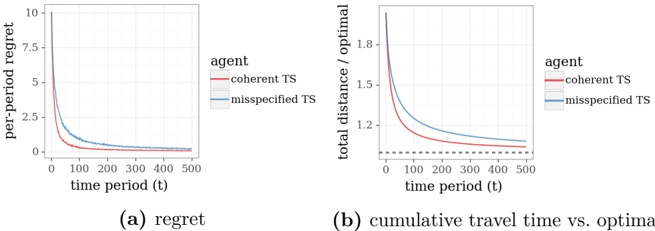
The image contains two line graphs comparing the performance of two agents ("coherent TS" and "misspecified TS") over time. Graph (a) shows "per-period regret," while graph (b) compares "cumulative travel time vs. optimal." Both graphs use time periods (t) on the x-axis and distinct performance metrics on the y-axis. The red line represents the "coherent TS" agent, and the blue line represents the "misspecified TS" agent.
---
### Components/Axes
#### Graph (a): Regret
- **X-axis**: Time period (t), ranging from 0 to 500.
- **Y-axis**: Per-period regret, ranging from 0 to 10.
- **Legend**:
- Red: Coherent TS
- Blue: Misspecified TS
- **Title**: "(a) regret"
#### Graph (b): Cumulative Travel Time vs. Optimal
- **X-axis**: Time period (t), ranging from 0 to 500.
- **Y-axis**: Total distance / optimal, ranging from 0 to 1.8.
- **Legend**:
- Red: Coherent TS
- Blue: Misspecified TS
- **Title**: "(b) cumulative travel time vs. optimal"
- **Dashed Line**: Horizontal reference line at y ≈ 1.0.
---
### Detailed Analysis
#### Graph (a): Regret
- **Coherent TS (Red Line)**:
- Starts at approximately 10 at t=0.
- Declines sharply to near 0 by t=100.
- Plateaus at ~0.1 by t=500.
- **Misspecified TS (Blue Line)**:
- Starts at ~9 at t=0.
- Declines to ~0.2 by t=500.
- Remains consistently above the red line throughout.
#### Graph (b): Cumulative Travel Time vs. Optimal
- **Coherent TS (Red Line)**:
- Starts at 1.8 at t=0.
- Declines steeply to ~1.0 by t=100.
- Approaches the dashed reference line (y=1.0) by t=500.
- **Misspecified TS (Blue Line)**:
- Starts at ~1.7 at t=0.
- Declines to ~1.1 by t=500.
- Remains above the red line and dashed reference line.
---
### Key Observations
1. **Rapid Initial Improvement**: Both agents show steep declines in regret and cumulative travel time during the first 100 time periods.
2. **Performance Gap**: The coherent TS agent consistently outperforms the misspecified TS agent in both metrics.
3. **Convergence**: The coherent TS agent’s cumulative travel time approaches the optimal value (dashed line at y=1.0) by t=500, while the misspecified TS agent does not.
---
### Interpretation
The data demonstrates that the coherent TS agent achieves significantly lower regret and closer alignment with optimal cumulative travel time compared to the misspecified TS agent. The rapid decline in both metrics suggests that both agents improve quickly, but the coherent TS maintains a sustained advantage. The dashed reference line in graph (b) highlights the optimal performance threshold, which the coherent TS approaches but does not fully reach by t=500. This implies that while the coherent TS is more efficient, there may still be room for further optimization. The misspecified TS’s persistent lag indicates potential flaws in its design or assumptions, leading to suboptimal outcomes over time.